SSC CGL Previous Year Questions: Data Interpretation - 4 - SSC CGL MCQ
30 Questions MCQ Test SSC CGL Previous Year Papers - SSC CGL Previous Year Questions: Data Interpretation - 4
DIRECTIONS: Study the bar graph and answer the question. (SSC Sub. Ins. 2015)

Q. The approximate percentage increase in quantity from 1997 to 1998 was :

DIRECTIONS: Study the bar graph and answer the question. (SSC Sub. Ins. 2015)

Q. Percentage fall in value from 2000 to 2001 in :

DIRECTIONS: Study the bar graph and answer the question. (SSC Sub. Ins. 2015)

Q. The difference between the bags exported in 1999 and 2000 was.

DIRECTIONS: Study the bar graph and answer the question. (SSC Sub. Ins. 2015)

Q. Value per bag was minimum in the year:
DIRECTIONS: Study the following graph which shows income and expenditure of a company over the years 2005-2009 and answer questions. (SSC CGL 1st Sit. 2014)

Q. The difference in profit (₹ in crores) of the company during 2006 and 2007 is
DIRECTIONS: Study the following graph which shows income and expenditure of a company over the years 2005-2009 and answer questions. (SSC CGL 1st Sit. 2014)

Q. In how many years was the income of the company less than the average income of the given years?
DIRECTIONS: Study the following graph which shows income and expenditure of a company over the years 2005-2009 and answer questions. (SSC CGL 1st Sit. 2014)

Q. The percentage increase in expenditure of the company from 2007 to 2008 is
DIRECTIONS: Study the following graph which shows income and expenditure of a company over the years 2005-2009 and answer questions. (SSC CGL 1st Sit. 2014)
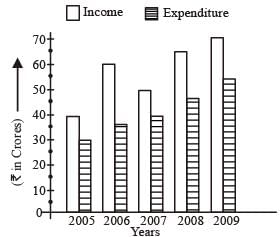
Q. Profit of the company was maximum in the year
DIRECTIONS: Study the following table and answer question. (SSC CGL 1st Sit. 2014)
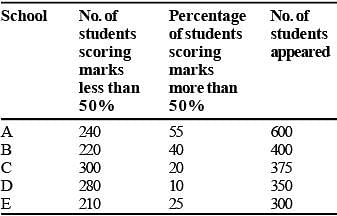
Q. The ratio of the total number of students scoring marks less than 50% to that of scoring marks exactly 50% is
DIRECTIONS: Study the following table and answer question. (SSC CGL 1st Sit. 2014)
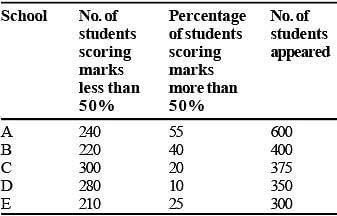
Q. Which school has the highest number of students scoring exactly 50% marks?
DIRECTIONS: Study the following table and answer question. (SSC CGL 1st Sit. 2014)
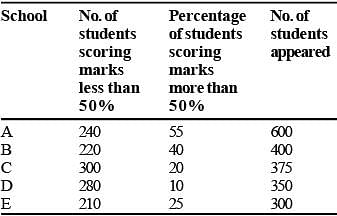
Q. The total number of students scoring 50% or more marks is
DIRECTIONS: The diagram shows the age distribution of the patients admitted to a hospital in a particular day. Study the diagram and answer. (SSC CHSL 2014)

Q. Number of patients of age between 55 years to 60 years, who got admitted to the hospital on that day is
DIRECTIONS: The diagram shows the age distribution of the patients admitted to a hospital in a particular day. Study the diagram and answer. (SSC CHSL 2014)

Q. Total number of patients of age more than 55 years, who got admitted to the hospital is
DIRECTIONS: The diagram shows the age distribution of the patients admitted to a hospital in a particular day. Study the diagram and answer. (SSC CHSL 2014)

Q. Number of patients of age more than 40 years and less than 55 years, who got admitted to the hospital on that day is
DIRECTIONS: The diagram shows the age distribution of the patients admitted to a hospital in a particular day. Study the diagram and answer. (SSC CHSL 2014)
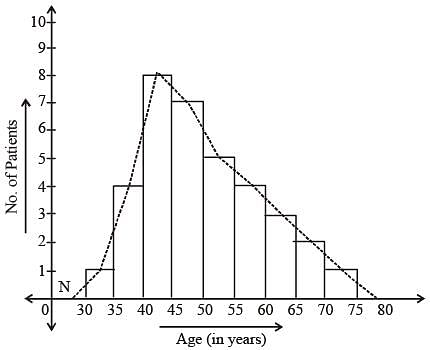
Q. Percentage of patients of age less than 45 years, who got admitted to the hospital on that day is approximately equal to
DIRECTIONS: The diagram shows the age distribution of the patients admitted to a hospital in a particular day. Study the diagram and answer. (SSC CHSL 2014)

Q. About 11% of the patients who got admitted to the hospital on that particular day were of age
DIRECTIONS: Sales of Books (in thousand numbers) from Six Branches - B1, B2, B3, B4, B5 and B6 of a Publishing Company in 2000 and 2001. Study the graph and answer the question that follow: (SSC CHSL 2014)

Q. Total sale of branches B1, B3 and B5 together for both the years (in thousand numbers) is
DIRECTIONS: Sales of Books (in thousand numbers) from Six Branches - B1, B2, B3, B4, B5 and B6 of a Publishing Company in 2000 and 2001. Study the graph and answer the question that follow: (SSC CHSL 2014)

Q. Find the ratio of the total sales of branch B2 for both years to the total sales of branch B4 for both years.
DIRECTIONS: Sales of Books (in thousand numbers) from Six Branches - B1, B2, B3, B4, B5 and B6 of a Publishing Company in 2000 and 2001. Study the graph and answer the question that follow: (SSC CHSL 2014)
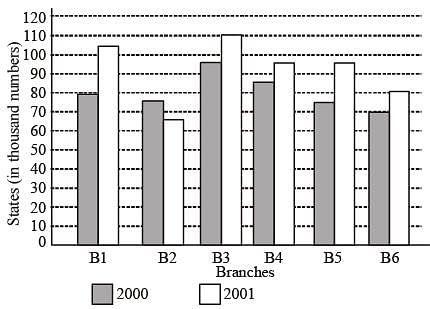
Q. Percentage of the average sale of branches B1, B2 and B3 in 2001 and the average sale of branches B1, B3 and B6 in 2000
DIRECTIONS: Sales of Books (in thousand numbers) from Six Branches - B1, B2, B3, B4, B5 and B6 of a Publishing Company in 2000 and 2001. Study the graph and answer the question that follow: (SSC CHSL 2014)

Q. Find the percentage increase in the sales of books of branch B3 in the year 2001 than the branch B2.
DIRECTIONS: The bar chart representing the number of first year B.Com. students of St. Xavier's College using different companies' smart phones. Study bar chart and answer the question that follow:

The bar chart representing the no. of students using different smart phones. (SSC Sub. Ins. 2014)
Q. The ratio of the number of boys to the number of girls using the smart phones of Samsung and Sony together is
DIRECTIONS: The bar chart representing the number of first year B.Com. students of St. Xavier's College using different companies' smart phones. Study bar chart and answer the question that follow:
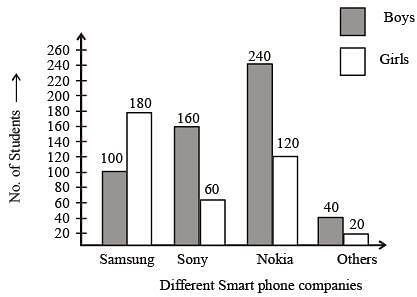
The bar chart representing the no. of students using different smart phones. (SSC Sub. Ins. 2014)
Q. What percentage of boys are using the smart phones of Samsung ?
DIRECTIONS: The bar chart representing the number of first year B.Com. students of St. Xavier's College using different companies' smart phones. Study bar chart and answer the question that follow:

The bar chart representing the no. of students using different smart phones. (SSC Sub. Ins. 2014)
Q. What percentage of girls are using the smart phones of Nokia?
DIRECTIONS: The bar chart representing the number of first year B.Com. students of St. Xavier's College using different companies' smart phones. Study bar chart and answer the question that follow:

The bar chart representing the no. of students using different smart phones. (SSC Sub. Ins. 2014)
Q. The difference between the total number of students using smart phones of Samsung combined together and the total number of students using smart phone of Sony taken together is
DIRECTIONS: The bar chart representing the number of first year B.Com. students of St. Xavier's College using different companies' smart phones. Study bar chart and answer the question that follow:

The bar chart representing the no. of students using different smart phones. (SSC Sub. Ins. 2014)
Q. Find the difference between the average sale of branches B5 and B6 in 2000 and 2001.
DIRECTIONS: The following pie-chart shows the monthly expenditure of a family on food, house rent, clothing, education, fuel and miscellaneous. Study the pie-chart and answer questions.

Q. If the expenditure for food is ₹9000, then the expenditure for education is (SSC Sub. Ins. 2014)
DIRECTIONS: The following pie-chart shows the monthly expenditure of a family on food, house rent, clothing, education, fuel and miscellaneous. Study the pie-chart and answer questions.

Q. The central angle of the sector for the expenditure on fuel (in degrees) is (SSC Sub. Ins. 2014)
DIRECTIONS: The following pie-chart shows the monthly expenditure of a family on food, house rent, clothing, education, fuel and miscellaneous. Study the pie-chart and answer questions.

Q. If the expenditure on fuel is ₹3000, then the total expenditure excluding expenditure on house rent and education is (SSC Sub. Ins. 2014)
DIRECTIONS: The following pie-chart shows the monthly expenditure of a family on food, house rent, clothing, education, fuel and miscellaneous. Study the pie-chart and answer questions.
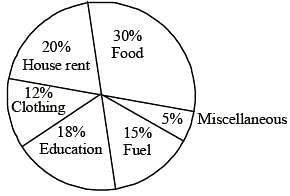
Q. If the percentage of expenditure on food is x% of the total percentage of expenditure on clothing, education and fuel, then x equals (SSC Sub. Ins. 2014)
DIRECTIONS: The following pie-chart shows the monthly expenditure of a family on food, house rent, clothing, education, fuel and miscellaneous. Study the pie-chart and answer questions.

Q. Total percentage of expenditure on house rent, clothing and fuel is greater than the percentage of expenditure on food by (SSC Sub. Ins. 2014)
|
316 docs|268 tests
|


