Electrical Engineering (EE) Exam  >  Electrical Engineering (EE) Tests  >  GATE Electrical Engineering (EE) Mock Test Series 2025  >  Test: Polar Plot - 2 - Electrical Engineering (EE) MCQ

Test: Polar Plot - 2 - Electrical Engineering (EE) MCQ


Test Description

10 Questions MCQ Test GATE Electrical Engineering (EE) Mock Test Series 2025 - Test: Polar Plot - 2

Test: Polar Plot - 2 for Electrical Engineering (EE) 2025 is part of GATE Electrical Engineering (EE) Mock Test Series 2025 preparation. The Test: Polar Plot - 2 questions and answers have been prepared according to the Electrical Engineering (EE) exam syllabus.The Test: Polar Plot - 2 MCQs are made for Electrical Engineering (EE) 2025 Exam. Find important definitions, questions, notes, meanings, examples, exercises, MCQs and online tests for Test: Polar Plot - 2 below.
Solutions of Test: Polar Plot - 2 questions in English are available as part of our GATE Electrical Engineering (EE) Mock Test Series 2025 for Electrical Engineering (EE) & Test: Polar Plot - 2 solutions in Hindi for GATE Electrical Engineering (EE) Mock Test Series 2025 course. Download more important topics, notes, lectures and mock test series for Electrical Engineering (EE) Exam by signing up for free. Attempt Test: Polar Plot - 2 | 10 questions in 30 minutes | Mock test for Electrical Engineering (EE) preparation | Free important questions MCQ to study GATE Electrical Engineering (EE) Mock Test Series 2025 for Electrical Engineering (EE) Exam | Download free PDF with solutions
Test: Polar Plot - 2 - Question 1

The polar plot of the open loop transfer function of a feedback control system intersects the real axis at -2. The gain margin of the system is

Detailed Solution for Test: Polar Plot - 2 - Question 1

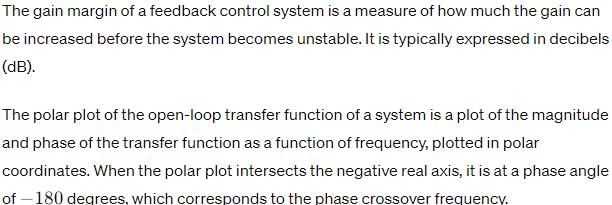
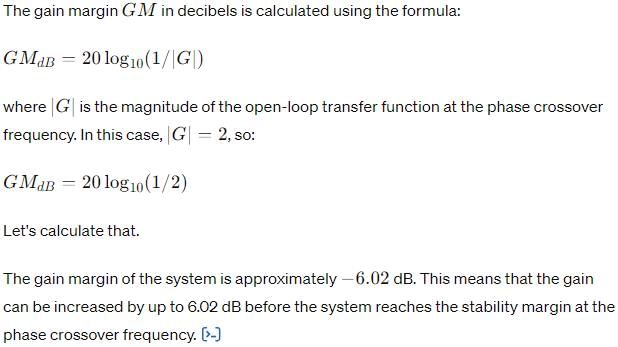
The gain margin is found by taking the reciprocal of the magnitude of the open-loop transfer function at the phase crossover frequency. If the polar plot intersects the real axis at −2, this means that the magnitude of the open-loop transfer function is 2 at the phase crossover frequency.

Test: Polar Plot - 2 - Question 2

The constant M circle for M = 1 is the

Detailed Solution for Test: Polar Plot - 2 - Question 2

For M = 1 the constant M circle is a straight line at x = -1/2.

Test: Polar Plot - 2 - Question 3

The polar plot of a transfer function passes through the critical point (-1,0). Gain margin is

Detailed Solution for Test: Polar Plot - 2 - Question 3

Gain margin of a polar plot passing through the critical point is zero.

Test: Polar Plot - 2 - Question 4

If the gain of the open-loop system is doubled, the gain margin

Detailed Solution for Test: Polar Plot - 2 - Question 4

Gain margin is nothing but the inverse of the gain. Hence if gain of open loop system is doubled, then the gain margin will becomes half.

Test: Polar Plot - 2 - Question 5

If a system has an open loop transfer function 1-s / 1+s, then the gain of the system at frequency of 1 rad/s will be

Detailed Solution for Test: Polar Plot - 2 - Question 5

The system is all pass system and the gain of the system at frequency of 1 rad/sec.

Test: Polar Plot - 2 - Question 6

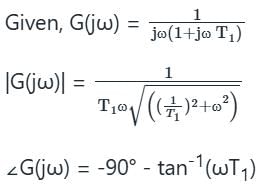
The gain margin for the system with open loop transfer function G(s) H(s) = G(s) = 2(1 + s) / s2 is

Detailed Solution for Test: Polar Plot - 2 - Question 6

Gain margin of a system is calculated at the phase cross over frequency and expressed in decibels.

Test: Polar Plot - 2 - Question 7

The open loop transfer function of a system is G(s) H(s) = K / (1 + s)(1 + 2s)(1 + 3s)
The phase cross over frequency ωc is

Detailed Solution for Test: Polar Plot - 2 - Question 7

Phase crossover frequency is calculated as by calculating the magnitude of the transfer function and equating it to 1 and the frequency calculated at this magnitude is phase cross over frequency.

Test: Polar Plot - 2 - Question 8

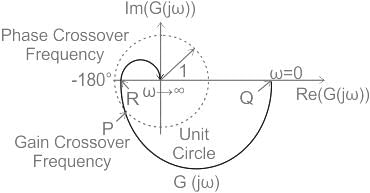
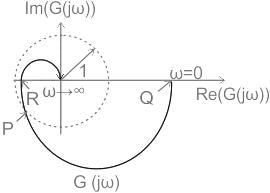
The Nyquist plot of a stable open-loop system G(jω) is plotted in the frequency range 0 ≤ ω < ∞ as shown. It is found to intersect a unit circle with center at the origin at the point �� = −0.77 − 0.64�� . The points �� and �� lie on G(jω) and assume values Q = 14.40 + 0.00j and R = −0.21 + 0.00j. The phase margin (PM) and the gain margin (GM) of the system are _____
Detailed Solution for Test: Polar Plot - 2 - Question 8

Concept

The phase margin is given by:

PM = 180° + (Phase of G(s) at gain cross-over frequency)

The frequency at which the magnitude of G(s) is unity is known as the gain cross-over frequency.

The gain margin is given by:

GM = 1/ (Gain of G(s) at phase cross-over frequency)

The frequency at which the phase angle of G(s) is -180 is known as the phase cross-over frequency.
Calculation

Point P gives gain cross-over frequency whereas point R gives phase cross-over frequency.
The phase of G(s) at gain cross-over frequency is given by:

ϕ = 39.73° 
Point P lies in the 3 quadrants, hence net angle is:
 

ϕ = 180° + 39.73° = 219.73° 

PM = 180° + 219.73° = 399.73° 

PM = 399.73° = 360° + 39.73 

PM = 39.73°

Point R = −0.21 + 0.00��

GM =  4.76

Test: Polar Plot - 2 - Question 9

Polar plot of transfer function is

Detailed Solution for Test: Polar Plot - 2 - Question 9

Polar plot:

The polar plot is a plot, that is drawn between the magnitude and the phase angle of G(jω) by varying ω from zero 0 to ∞.


Test: Polar Plot - 2 - Question 10

Obtain the polar plot for a system whose characteristic equation is
s3 + 3s2 + 2s + 4 = 0

Detailed Solution for Test: Polar Plot - 2 - Question 10

Concept:

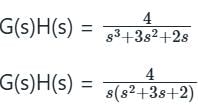
The characteristic equation is:

1 + G(s)H(s) = s3 + 3s2 + 2s + 4 

where G(s)H(s) is the open loop transfer function.

Calculation:

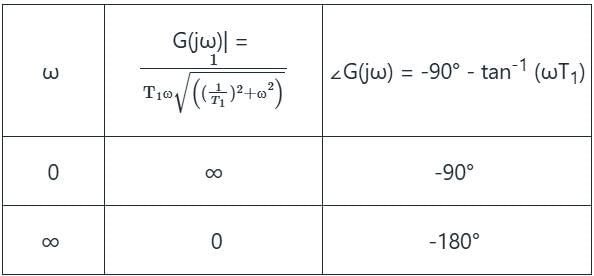
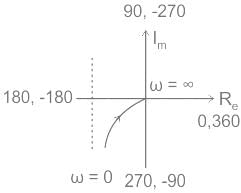
There is one pole at the origin, so the polar plot will start from -90° and end at -270° due to order = 3.


The frequency at which the phase angle of OLTF becomes -180° or the imaginary part of OLTF becomes zero is known as the phase cross-over frequency.

ωpc = √2 rad/sec
Hence, option d is correct.

25 docs|247 tests
Information about Test: Polar Plot - 2 Page
In this test you can find the Exam questions for Test: Polar Plot - 2 solved & explained in the simplest way possible. Besides giving Questions and answers for Test: Polar Plot - 2, EduRev gives you an ample number of Online tests for practice
Download as PDF