Math Olympiad Test: Statistics- 2 - Class 9 MCQ
15 Questions MCQ Test - Math Olympiad Test: Statistics- 2
The no. of class intervals, if the magnitude of class interval is 4 will be:
Data: 31, 23, 19, 29, 20, 16, 22, 10, 13, 34, 33, 38, 36, 24, 18, 15, 12, 30, 27, 23, 20
Data: 31, 23, 19, 29, 20, 16, 22, 10, 13, 34, 33, 38, 36, 24, 18, 15, 12, 30, 27, 23, 20
The class marks of a distribution are:
52, 47, 57, 67, 62, 72, 82, 87, 97, 92, 102.
Q. The lower and upper limits of first class interval will be:
52, 47, 57, 67, 62, 72, 82, 87, 97, 92, 102.
Q. The lower and upper limits of first class interval will be:
The mid–value and upper limit of a class interval are 41 and 47 respectively. The class size will be:
In the ‘more–than’ type of ogive the cumulative frequency is plotted against:

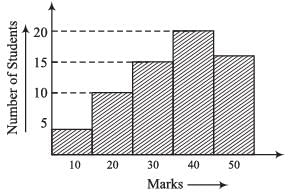
The frequency of students is highest in the class interval:
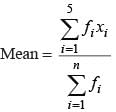
The mean of x1, x2, ……., xn is  , then the value of:


If each number in (Prob - 17) is multiplied by k, the new mean will be:
The mean of 10 numbers is 16. If two consecutive numbers are excluded, the new mean is 18. The sum of the excluded numbers is:
The sum of deviations of a set of n values x1, x2, …… xn measured from 50 is – 10 and the sum of deviations of the values from 46 is 70. The value of n is:
The new median, of the following data, if 37 is replaced by 5.
7, 9, 16, 25, 31, 36, 37, 39, 40, 42, 43
The mode of the following data is:
29, 40, 41, 46, 45, 44, 43, 29, 40, 41, 46, 44, 44, 47, 49, 53, 29, 57, 44, 43, 41, 28, 16, 26.


 .
.


 …(i)
…(i) …(ii)
…(ii)


 = 6th number will be the median.


