NEET Exam  >  NEET Tests  >  Physics Class 11  >  Multiple Choice Questions (MCQs): Graphical Representation of Motion - NEET MCQ

Multiple Choice Questions (MCQs): Graphical Representation of Motion - NEET MCQ


Test Description

10 Questions MCQ Test Physics Class 11 - Multiple Choice Questions (MCQs): Graphical Representation of Motion

Multiple Choice Questions (MCQs): Graphical Representation of Motion for NEET 2024 is part of Physics Class 11 preparation. The Multiple Choice Questions (MCQs): Graphical Representation of Motion questions and answers have been prepared according to the NEET exam syllabus.The Multiple Choice Questions (MCQs): Graphical Representation of Motion MCQs are made for NEET 2024 Exam. Find important definitions, questions, notes, meanings, examples, exercises, MCQs and online tests for Multiple Choice Questions (MCQs): Graphical Representation of Motion below.
Solutions of Multiple Choice Questions (MCQs): Graphical Representation of Motion questions in English are available as part of our Physics Class 11 for NEET & Multiple Choice Questions (MCQs): Graphical Representation of Motion solutions in Hindi for Physics Class 11 course. Download more important topics, notes, lectures and mock test series for NEET Exam by signing up for free. Attempt Multiple Choice Questions (MCQs): Graphical Representation of Motion | 10 questions in 10 minutes | Mock test for NEET preparation | Free important questions MCQ to study Physics Class 11 for NEET Exam | Download free PDF with solutions
Multiple Choice Questions (MCQs): Graphical Representation of Motion - Question 1

 Figure shows the displacement – time graph of a particle moving along X – axis.

Detailed Solution for Multiple Choice Questions (MCQs): Graphical Representation of Motion - Question 1

Because velocity is the slope of the x-t graph.(dx/dt=V) and by looking at the graph it can be seen that upto time T0 slope is constant so velocity will be constant and after time T0 slope is zero ( line is parallel to X axis) so the velocity will be zero.

Multiple Choice Questions (MCQs): Graphical Representation of Motion - Question 2

The graph represents the velocity time for the first 4 seconds of motion. The distance covered is  
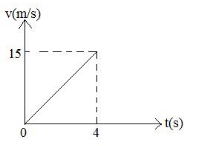
Detailed Solution for Multiple Choice Questions (MCQs): Graphical Representation of Motion - Question 2

Calculate the area of the graph as area of v-t grph gives dis. 1/2×4×15=30

1 Crore+ students have signed up on EduRev. Have you? Download the App
Multiple Choice Questions (MCQs): Graphical Representation of Motion - Question 3

A person goes from his home to his office taking one hour. There he works for 2 hours and then in half hour reaches home back. A representative displacement-time graph

Detailed Solution for Multiple Choice Questions (MCQs): Graphical Representation of Motion - Question 3

We have given in the information that the person is in his office for two hours hence his position must not vary for two hours, that is the horizontal part in the graph which is only observed in the graph of option c.

Multiple Choice Questions (MCQs): Graphical Representation of Motion - Question 4

Speed time graph of a particle moving along a fixed direction is shown in the figure below. The average speed of the particle over the interval: t = 0 s to 10 s.
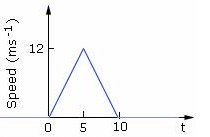
Detailed Solution for Multiple Choice Questions (MCQs): Graphical Representation of Motion - Question 4

From the given graph we get that the area of the given graph is total distance covered that is 
=  ½ x 10 x 12
=  60m
And total time taken is 10 sec
Thus average speed is  60m / 10sec
 = 6 m/s

Multiple Choice Questions (MCQs): Graphical Representation of Motion - Question 5

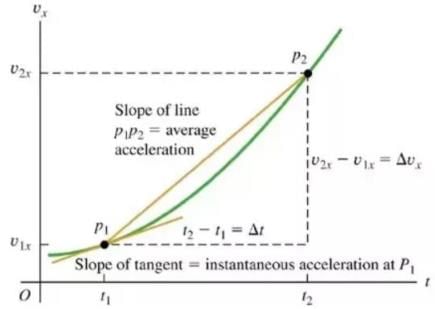
The acceleration at any instant is the slope of the tangent of the ________ curve at that instant:

Detailed Solution for Multiple Choice Questions (MCQs): Graphical Representation of Motion - Question 5

This can be verified graphically

ObtaIning instantaneous acceleration from graph

Multiple Choice Questions (MCQs): Graphical Representation of Motion - Question 6

Slope of displacement time graph or x-t graph gives us the particles’ ____________.

Detailed Solution for Multiple Choice Questions (MCQs): Graphical Representation of Motion - Question 6

Velocity is a physical vector quantity; both magnitude and direction are needed to define it. The scalar absolute value (magnitude) of velocity is called "speed", being a coherent derived unit whose quantity is measured in the SI (metric system) as metres per second (m/s) or as the SI base unit of (m⋅s−1).

Multiple Choice Questions (MCQs): Graphical Representation of Motion - Question 7

Two balls of equal mass and of Perfectly inelastic material are lying on the floor. One of the balls with velocity V is made to strike the second ball. Both the balls after impact will move with a velocity

Detailed Solution for Multiple Choice Questions (MCQs): Graphical Representation of Motion - Question 7

Given:

Let two balls A and B have mass mA, mB respectively, and their initial velocities are uA and uB. After the collision, they will move with the same velocity, vo

Given that mass of both balls are same.

So  mA = mB = m

uA = V,  uB = 0

From the Concept of Momentum Conservation:

mAuA + mBuB = (m+m)vo

mV = 2mvo

vo = V/2

Both the balls after impact will move with velocity v/2.

Multiple Choice Questions (MCQs): Graphical Representation of Motion - Question 8

On velocity-time graph when two curves coincide, the objects will have

Detailed Solution for Multiple Choice Questions (MCQs): Graphical Representation of Motion - Question 8

A velocity time graph represents the velocity of an object at a very certain time. If two curves collide that means that their velocities at the given time are equal. Their acceleration may or may not be equal depending upon the slope of the curve at the point of intersection.

Multiple Choice Questions (MCQs): Graphical Representation of Motion - Question 9

Which position – time graph represents the motion of two objects that will never meet?

Detailed Solution for Multiple Choice Questions (MCQs): Graphical Representation of Motion - Question 9

Correct option is C. Not possible to extend the graph to second quadrant as time cannot be negative.

Multiple Choice Questions (MCQs): Graphical Representation of Motion - Question 10

Linear inequalities are graphically represented on Cartesian plane by a

Detailed Solution for Multiple Choice Questions (MCQs): Graphical Representation of Motion - Question 10

The graph of an inequality in two variables is the set of points that represents all solutions to the inequality. A linear inequality divides the coordinate plane into two halves by a boundary line where one half represents the solutions of the inequality. The boundary line is dashed for > and < and solid for ≤ and ≥.

102 videos|411 docs|121 tests
Information about Multiple Choice Questions (MCQs): Graphical Representation of Motion Page
In this test you can find the Exam questions for Multiple Choice Questions (MCQs): Graphical Representation of Motion solved & explained in the simplest way possible. Besides giving Questions and answers for Multiple Choice Questions (MCQs): Graphical Representation of Motion, EduRev gives you an ample number of Online tests for practice

Top Courses for NEET

102 videos|411 docs|121 tests
Download as PDF

Top Courses for NEET