Class 2 Exam  >  Class 2 Tests  >  Math Olympiad for Class 2  >  Olympiad Test: Pictographs - 2 - Class 2 MCQ

Olympiad Test: Pictographs - 2 - Class 2 MCQ


Test Description

15 Questions MCQ Test Math Olympiad for Class 2 - Olympiad Test: Pictographs - 2

Olympiad Test: Pictographs - 2 for Class 2 2025 is part of Math Olympiad for Class 2 preparation. The Olympiad Test: Pictographs - 2 questions and answers have been prepared according to the Class 2 exam syllabus.The Olympiad Test: Pictographs - 2 MCQs are made for Class 2 2025 Exam. Find important definitions, questions, notes, meanings, examples, exercises, MCQs and online tests for Olympiad Test: Pictographs - 2 below.
Solutions of Olympiad Test: Pictographs - 2 questions in English are available as part of our Math Olympiad for Class 2 for Class 2 & Olympiad Test: Pictographs - 2 solutions in Hindi for Math Olympiad for Class 2 course. Download more important topics, notes, lectures and mock test series for Class 2 Exam by signing up for free. Attempt Olympiad Test: Pictographs - 2 | 15 questions in 30 minutes | Mock test for Class 2 preparation | Free important questions MCQ to study Math Olympiad for Class 2 for Class 2 Exam | Download free PDF with solutions
Olympiad Test: Pictographs - 2 - Question 1

The picture graph shows some cartoons that children like to watch.
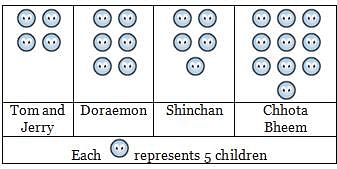
What 50 children like to watch?

Detailed Solution for Olympiad Test: Pictographs - 2 - Question 1

Number of children who like to watch Chhota Bheem = 10 x 5 = 50

Olympiad Test: Pictographs - 2 - Question 2

Direction: The given pictograph shows how many toys are owned by children of a locality.
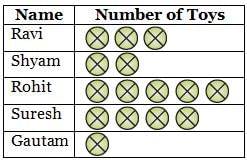
In this pictograph, represents 5 toys. Now answer the following questions.

How many toys are owned by the five friends shown in the pictograph?

Detailed Solution for Olympiad Test: Pictographs - 2 - Question 2

Total toys = 15 + 10 + 25 + 20 + 5 = 75

Olympiad Test: Pictographs - 2 - Question 3

Direction: The given pictograph shows how many toys are owned by children of a locality.
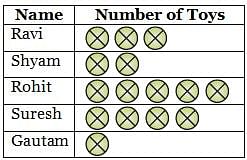
In this pictograph, represents 5 toys. Now answer the following questions.

Which student owns 20 toys?

Detailed Solution for Olympiad Test: Pictographs - 2 - Question 3

Suresh owns 20 toys.

Olympiad Test: Pictographs - 2 - Question 4

Direction: The given pictograph shows how many toys are owned by children of a locality.
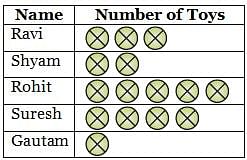
In this pictograph, represents 5 toys. Now answer the following questions.

The maximum number of toys owned by a child is:

Detailed Solution for Olympiad Test: Pictographs - 2 - Question 4

Maximum number of toys owned by Rohit = 25

Olympiad Test: Pictographs - 2 - Question 5

Direction: Read the following data carefully and choose the best option.

Which class has the maximum number of students?

Detailed Solution for Olympiad Test: Pictographs - 2 - Question 5

From the data provided, the number of students in each class is as follows:

  • Class 1: 25 students
  • Class 2: 25 students
  • Class 3: 22 students
  • Class 4: 15 students
  • Class 5: 18 students

The classes with the maximum number of students are Class 1 and Class 2, both having 25 students. However, since Class 1 is listed first, it is the answer.

Thus, the correct answer is Option A: Class 1.

Olympiad Test: Pictographs - 2 - Question 6

Direction: Read the following data carefully and choose the best option.

How many students study in Class 4?

Detailed Solution for Olympiad Test: Pictographs - 2 - Question 6

From the data provided:

  • Class 1: 25 students
  • Class 2: 22 students
  • Class 3: 22 students
  • Class 4: 15 students
  • Class 5: 20 students

For Class 4, the number of students is 15.

Thus, the correct answer is Option C: 18 is not correct since the data indicates 15 students.

Olympiad Test: Pictographs - 2 - Question 7

Direction: Following data represents number of  children who like each of given fruits. Read the information and choose the correct option.
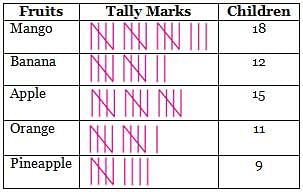
_______ is liked by minimum number of children.

Detailed Solution for Olympiad Test: Pictographs - 2 - Question 7

The number of children who like each fruit is:

  • Mango: 18 children
  • Banana: 12 children
  • Apple: 15 children
  • Orange: 11 children
  • Pineapple: 9 children

The Pineapple is liked by the minimum number of children (9 children).

Thus, the correct answer is Option D: Pineapple.

Olympiad Test: Pictographs - 2 - Question 8

Direction: Following data represents number of  children who like each of given fruits. Read the information and choose the correct option.
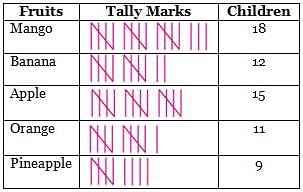
Total number of children who like fruits are:

Detailed Solution for Olympiad Test: Pictographs - 2 - Question 8

The total number of children who like each fruit is:

  • Mango: 18 children
  • Banana: 12 children
  • Apple: 15 children
  • Orange: 11 children
  • Pineapple: 9 children

Now, add these numbers:

18 + 12 + 15 + 11 + 9 = 65

Thus, the total number of children who like fruits is 65.

The correct answer is Option C: 65.

Olympiad Test: Pictographs - 2 - Question 9

Direction: Following data represents number of  children who like each of given fruits. Read the information and choose the correct option.
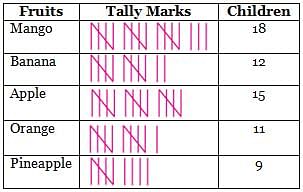
What is written at the bottom of the pictograph?

Detailed Solution for Olympiad Test: Pictographs - 2 - Question 9

In a pictograph, the scale is typically the representation of the number of units each symbol or mark represents. In this case, tally marks are used to represent the number of children who like each fruit, and the scale would indicate how many children each tally mark represents.

Thus, the correct answer is Option B: Scale.

Olympiad Test: Pictographs - 2 - Question 10

Direction: Following data represents number of  children who like each of given fruits. Read the information and choose the correct option.
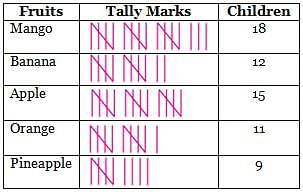
When pictures are used to represent information it is known as _______.

Detailed Solution for Olympiad Test: Pictographs - 2 - Question 10

A pictograph is a chart that uses pictures or symbols to represent data or information. In this case, tally marks are used to represent the number of children who like each fruit, and the tally marks are considered a visual representation of data.

Thus, the correct answer is Option C: Pictograph.

Olympiad Test: Pictographs - 2 - Question 11

Direction: The given table gives the information about the number of days it rained in different months of a year.
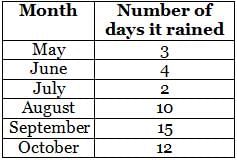
Now answer the following questions :

Name the month in which it rained for minimum number of days.

Detailed Solution for Olympiad Test: Pictographs - 2 - Question 11

From the given data in the table:

  • May: 3 days
  • June: 4 days
  • July: 2 days
  • August: 10 days
  • September: 15 days
  • October: 12 days

The month with the minimum number of rainy days is July, with only 2 days of rain. Therefore, the correct answer is C: July.

Olympiad Test: Pictographs - 2 - Question 12

Direction: The given table gives the information about the number of days it rained in different months of a year.
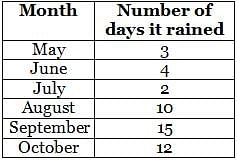
Now answer the following questions :

The month in which it rained for 10 days is:

Detailed Solution for Olympiad Test: Pictographs - 2 - Question 12

From the given data in the table:

  • May: 3 days
  • June: 4 days
  • July: 2 days
  • August: 10 days
  • September: 15 days
  • October: 12 days

The month in which it rained for exactly 10 days is August. Therefore, the correct answer is C: August.

Olympiad Test: Pictographs - 2 - Question 13

Direction: The given table gives the information about the number of days it rained in different months of a year.
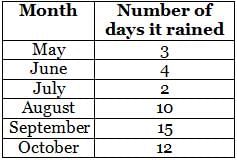
Now answer the following questions :

Name the month in which it rained for maximum number of days.

Detailed Solution for Olympiad Test: Pictographs - 2 - Question 13

From the given data in the table:

  • May: 3 days
  • June: 4 days
  • July: 2 days
  • August: 10 days
  • September: 15 days
  • October: 12 days

The month in which it rained for the maximum number of days is September, with 15 days of rain. Therefore, the correct answer is A: September.

Olympiad Test: Pictographs - 2 - Question 14

Direction: The given table gives the information about the number of days it rained in different months of a year.
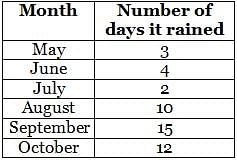
Now answer the following questions :

The number of days in which it rained in August is:

Detailed Solution for Olympiad Test: Pictographs - 2 - Question 14

From the given data in the table:

  • May: 3 days
  • June: 4 days
  • July: 2 days
  • August: 10 days
  • September: 15 days
  • October: 12 days

The number of days it rained in August is 10 days. Therefore, the correct answer is D: 10.

Olympiad Test: Pictographs - 2 - Question 15

Direction: The given table gives the information about the number of days it rained in different months of a year.
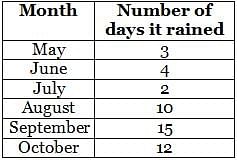
Now answer the following questions :

Total number of days in which it rained from July to September is:

Detailed Solution for Olympiad Test: Pictographs - 2 - Question 15

To find the total number of days it rained from July to September, add the number of days it rained in each of these months:

  • July: 2 days
  • August: 10 days
  • September: 15 days

Total = 2 + 10 + 15 = 27 days

Therefore, the correct answer is B: 27.

28 videos|29 docs|78 tests
Information about Olympiad Test: Pictographs - 2 Page
In this test you can find the Exam questions for Olympiad Test: Pictographs - 2 solved & explained in the simplest way possible. Besides giving Questions and answers for Olympiad Test: Pictographs - 2, EduRev gives you an ample number of Online tests for practice
28 videos|29 docs|78 tests
Download as PDF