Mechanical Engineering Exam  >  Mechanical Engineering Tests  >  Past Year Questions: Probability And Statistics - Mechanical Engineering MCQ

Past Year Questions: Probability And Statistics - Mechanical Engineering MCQ


Test Description

7 Questions MCQ Test - Past Year Questions: Probability And Statistics

Past Year Questions: Probability And Statistics for Mechanical Engineering 2024 is part of Mechanical Engineering preparation. The Past Year Questions: Probability And Statistics questions and answers have been prepared according to the Mechanical Engineering exam syllabus.The Past Year Questions: Probability And Statistics MCQs are made for Mechanical Engineering 2024 Exam. Find important definitions, questions, notes, meanings, examples, exercises, MCQs and online tests for Past Year Questions: Probability And Statistics below.
Solutions of Past Year Questions: Probability And Statistics questions in English are available as part of our course for Mechanical Engineering & Past Year Questions: Probability And Statistics solutions in Hindi for Mechanical Engineering course. Download more important topics, notes, lectures and mock test series for Mechanical Engineering Exam by signing up for free. Attempt Past Year Questions: Probability And Statistics | 7 questions in 10 minutes | Mock test for Mechanical Engineering preparation | Free important questions MCQ to study for Mechanical Engineering Exam | Download free PDF with solutions
Past Year Questions: Probability And Statistics - Question 1

 A residential school stipulates the study hours as 8.00 pm to 10.30 pm. Warden makes random checks on a certain student 11 occasions a day during the study hours over a period of 10 days and observes that he is studying on 71 occasions.Using 95% confidence interval, the estimated minimum hours of his study during that 10 day period is

[2003]

Detailed Solution for Past Year Questions: Probability And Statistics - Question 1

Number of total observation in 10 days = 11 × 10 = 110
No. of observation when studying = 71

(Probability of studying) Total studying hour in 10 days = (2.5 hr) × 10 Hence, Minimum no. of hours of studying in 10 days = (25 hr) × p = 25 × 0.6455 = 16.13 hrs.

Past Year Questions: Probability And Statistics - Question 2

 The distribution of lead time demand for an item is as follows:​The reorder level is 1.25 times the expected value of the lead time demand. The service level is

[2005]

Detailed Solution for Past Year Questions: Probability And Statistics - Question 2

The expected value of  lead time demand Þ 80 × 0.20 + 100 × 0.25 + 120 × 0.30 + 140 ×
0.25 = 112
Reorder level is 1.25 times the lead time demand.
So, Reorder value = 1.25 × 112 = 140 Here, we can see that both the maximum demand and reorder value are equal, service level = 100%

1 Crore+ students have signed up on EduRev. Have you? Download the App
Past Year Questions: Probability And Statistics - Question 3

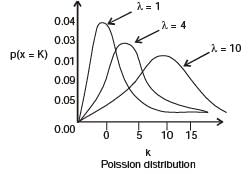
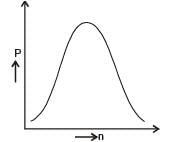
The jobs arrive at a facility, for service, in a random manner. The probability distribution of number of arrivals of jobs in a fixed time interval is

[2014]

Detailed Solution for Past Year Questions: Probability And Statistics - Question 3


Since arrival rates depends upon the time factor, so accordingly graph can be chosen from Poisson distribution, but normal distribution expresses same result throughout.

Past Year Questions: Probability And Statistics - Question 4

Jobs arrive at a facility at an average rate of 5 in an 8 hour shift. The arrival of the jobs follows Poisson distribution. The average service time of a job on the facility is 40 minutes. The service time follows exponential distribution. Idle time (in hours) at the facility per shift will be

[2014]

Detailed Solution for Past Year Questions: Probability And Statistics - Question 4

Arrival rate = 5 jobs in 8 hr service time = 40 min/job
Total service time = 40 × 5 = 200 min

Past Year Questions: Probability And Statistics - Question 5

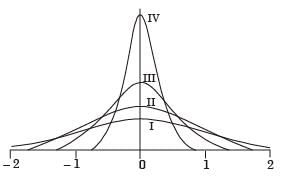
Among the four normal distributions with probability density functions as shown below, which one has the lowest variance?​

[2015]

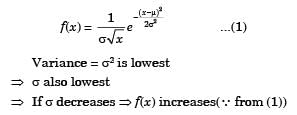
Detailed Solution for Past Year Questions: Probability And Statistics - Question 5

We have Probability distribution function of Normal Distribution
⇒ Curve will have highest peak

Past Year Questions: Probability And Statistics - Question 6

A sample of 15 data is as follows: 17, 18, 17, 17, 13, 18, 5, 5, 6, 7, 8, 9, 20, 17, 3. The mode of the data is

Detailed Solution for Past Year Questions: Probability And Statistics - Question 6

Th e data which is r ep eated fo r max im um number of times is 17.

Past Year Questions: Probability And Statistics - Question 7

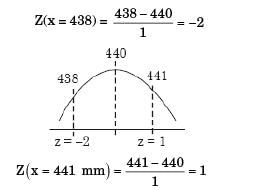
 The lengths of a large stock of titanium rods follow a normal distribution with a mean (μ) of 440 mm and a standard deviation (��) of 1 mm.What is the percentage of rods whose lengths lie between 438 mm and 441 mm ?

[2019]

Detailed Solution for Past Year Questions: Probability And Statistics - Question 7

Gi ven , m ean , (μ) = 440 m m Standard deviation, s = 1 mm

lower limit,

Percentage of rods whose lengths lie between 438 mm and 441 mm. = 0.3413 + (0.5 – 0.0228)
= 0.81854 = 81.854%

Information about Past Year Questions: Probability And Statistics Page
In this test you can find the Exam questions for Past Year Questions: Probability And Statistics solved & explained in the simplest way possible. Besides giving Questions and answers for Past Year Questions: Probability And Statistics, EduRev gives you an ample number of Online tests for practice

Top Courses for Mechanical Engineering

Download as PDF

Top Courses for Mechanical Engineering