Test: Automatic Control Systems - 6 - Electrical Engineering (EE) MCQ
25 Questions MCQ Test - Test: Automatic Control Systems - 6

A phase lead network with 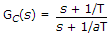 where a < 1, gives maximum phase lead at a frequency equal to
where a < 1, gives maximum phase lead at a frequency equal to
If C is thermal capacitance, m is mass of liquid and c is specific heat, then
Assertion (A): The concept of impulse function is useful in differentiating discontinuous functions.
Reason (R): 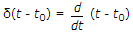
In a two phase servomotor, if R is rotor resistance, X is rotor reactance, L is rotor length D is rotor diameter then
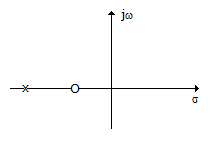
For the log magnitude Bode plot of the given figure, the transfer function is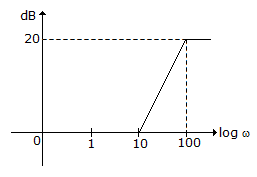
A first-order system has a time constant t. For unit ramp input, the steady state error is
For the equation  where Q is heat energy, Ct is thermal capacitance and θ is temperature, the analogous electrical equation is
Optical encoders most commonly used in control systems are
A second order system exhibits 100% overshoot. The damping ratio is
The log magnitude curve for a constant gain K is a horizontal straight line at a magnitude 20 log K dB.
Transfer functions of even complicated components can be found by frequency response tests.
The shape of torque-speed curve of a two phase servo- motor mostly depends on
In a lag network the input frequency is 100 fc where fc is critical frequency. The voltage gain is
Assertion (A): Temperature control of the passenger compartment of car uses both feed forward and feedback controls.
Reason (R): Feed forward control gives corrective action before the disturbance affects the output and feedback control applies corrective action after output changes.
Assertion (A): Most of actual systems are non-linear.
Reason (R): Non linearity may be due to saturation, dead zone, square law etc.
The correct sequence of events to improve system stability is
The static equation of a system is 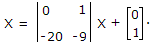 The poles of this system are located at
The pole-zero configuration of the given figure can be for
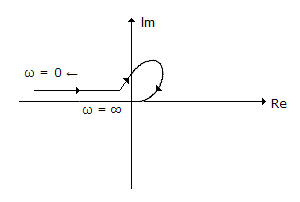
Which of the following represents constant magnitude locus for M = 1?
Assertion (A): A synchro control transformer has nearly constant impedance across its rotor terminals.
Reason (R): Rotor of a synchro control transformer is cylindrical so as to give uniform flux distribution.
The log magnitude plot of the given figure is for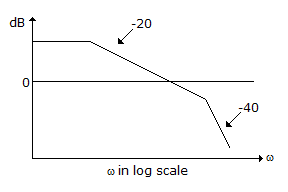
Important Questions for Automatic Control Systems - 6
Automatic Control Systems - 6 MCQs with Answers
Online Tests for Automatic Control Systems - 6
|
© EduRev
|
Education Revolution
|


|


within 7 days!