Test: Bar Graphs- 4 - CAT MCQ
5 Questions MCQ Test - Test: Bar Graphs- 4

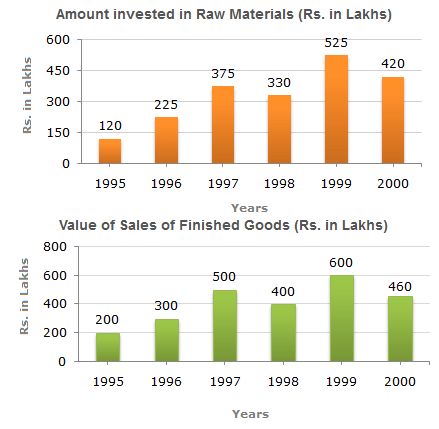
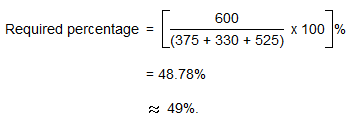
Out of the two bar graphs provided below, one shows the amounts (in Lakh Rs.) invested by a Company in purchasing raw materials over the years and the other shows the values (in Lakh Rs.) of finished goods sold by the Company over the years.
Q.
The maximum difference between the amount invested in Raw materials and value of sales of finished goods was during the year?
Out of the two bar graphs provided below, one shows the amounts (in Lakh Rs.) invested by a Company in purchasing raw materials over the years and the other shows the values (in Lakh Rs.) of finished goods sold by the Company over the years.
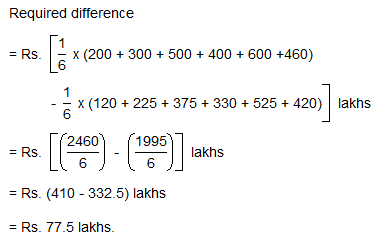
The value of sales of finished goods in 1999 was approximately what percent of the sum of amount invested in Raw materials in the years 1997, 1998 and 1999?

Out of the two bar graphs provided below, one shows the amounts (in Lakh Rs.) invested by a Company in purchasing raw materials over the years and the other shows the values (in Lakh Rs.) of finished goods sold by the Company over the years.
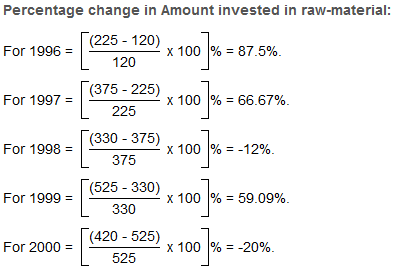
What was the difference between the average amount invested in Raw materials during the given period and the average value of sales of finished goods during this period?
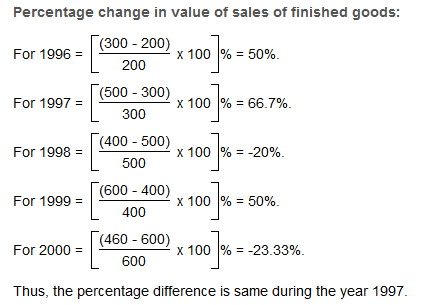
Out of the two bar graphs provided below, one shows the amounts (in Lakh Rs.) invested by a Company in purchasing raw materials over the years and the other shows the values (in Lakh Rs.) of finished goods sold by the Company over the years.
In which year, the percentage change (compared to the previous year) in the investment on Raw materials is same as that in the value of sales of finished goods?
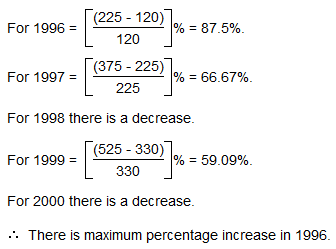
Out of the two bar graphs provided below, one shows the amounts (in Lakh Rs.) invested by a Company in purchasing raw materials over the years and the other shows the values (in Lakh Rs.) of finished goods sold by the Company over the years.
In which year, there has been a maximum percentage increase in the amount invested in Raw materials as compared to the previous year?


Important Questions for Bar Graphs- 4
Bar Graphs- 4 MCQs with Answers
Online Tests for Bar Graphs- 4
|
© EduRev
|
Education Revolution
|


|


