Commerce Exam  >  Commerce Tests  >  Economics Class 11  >  Test: Collection, Organisation and Presentation of Data- Assertions & Reason Type Questions - Commerce MCQ

Test: Collection, Organisation and Presentation of Data- Assertions & Reason Type Questions - Commerce MCQ


Test Description

20 Questions MCQ Test Economics Class 11 - Test: Collection, Organisation and Presentation of Data- Assertions & Reason Type Questions

Test: Collection, Organisation and Presentation of Data- Assertions & Reason Type Questions for Commerce 2024 is part of Economics Class 11 preparation. The Test: Collection, Organisation and Presentation of Data- Assertions & Reason Type Questions questions and answers have been prepared according to the Commerce exam syllabus.The Test: Collection, Organisation and Presentation of Data- Assertions & Reason Type Questions MCQs are made for Commerce 2024 Exam. Find important definitions, questions, notes, meanings, examples, exercises, MCQs and online tests for Test: Collection, Organisation and Presentation of Data- Assertions & Reason Type Questions below.
Solutions of Test: Collection, Organisation and Presentation of Data- Assertions & Reason Type Questions questions in English are available as part of our Economics Class 11 for Commerce & Test: Collection, Organisation and Presentation of Data- Assertions & Reason Type Questions solutions in Hindi for Economics Class 11 course. Download more important topics, notes, lectures and mock test series for Commerce Exam by signing up for free. Attempt Test: Collection, Organisation and Presentation of Data- Assertions & Reason Type Questions | 20 questions in 40 minutes | Mock test for Commerce preparation | Free important questions MCQ to study Economics Class 11 for Commerce Exam | Download free PDF with solutions
Test: Collection, Organisation and Presentation of Data- Assertions & Reason Type Questions - Question 1

Directions : In the following questions, a statement of Assertion (A) is followed by a statement of Reason (R). Mark the correct choice as:

Assertion (A): The questionnaire should be brief, simple, clear and precise.

Reason (R): Questionnaire needs to be able to collect data from the individuals without making it redundant and boring.

Detailed Solution for Test: Collection, Organisation and Presentation of Data- Assertions & Reason Type Questions - Question 1
The questions should be simple, clear and precise. Its language should be very simple so that informants may easily understand. Questionnaire is a subjective method in construction and objective method in use. It is used when factual information is required. The questionnaire is designed in such a way that the desired qualities of a person can be measured. Questionnaires can be used both individually and collectively. If a questionnaire is used for a group then it helps in saving time, money and labor.
Test: Collection, Organisation and Presentation of Data- Assertions & Reason Type Questions - Question 2

Directions : In the following questions, a statement of Assertion (A) is followed by a statement of Reason (R). Mark the correct choice as:

Assertion (A): Secondary data is taken from already available sources.

Reason (R): Government Publications are a very good source of secondary data.

Detailed Solution for Test: Collection, Organisation and Presentation of Data- Assertions & Reason Type Questions - Question 2
If the data have been collected and processed (scrutinised and tabulated) by some other agency, they are called Secondary Data. They can be obtained either from published sources such as government reports, documents, newspapers, books written by economists or from any other source, for example, a website. Thus, the data are primary to the source that collects and processes them for the first time and secondary for all sources that later use such data. Use of secondary data saves time and cost. For example, after collecting the data on the popularity of the film star among students, you publish a report. If somebody uses the data collected by you for a similar study, it becomes secondary data.

Published sources are the sources used for collection of secondary data. These sources are in the form of reports and newspapers which are provided by government publications, private publications and foreign publications. For instance, the Reserve Bank of India Bulletin, Indian trade journals, reports on currency and finance and reports by private companies are all examples of published sources of data.

1 Crore+ students have signed up on EduRev. Have you? Download the App
Test: Collection, Organisation and Presentation of Data- Assertions & Reason Type Questions - Question 3

Directions : In the following questions, a statement of Assertion (A) is followed by a statement of Reason (R). Mark the correct choice as:

Assertion (A): A good questionnaire helps in the collection of Primary Data.

Reason (R): Primary Data is the first hand data collection.

Detailed Solution for Test: Collection, Organisation and Presentation of Data- Assertions & Reason Type Questions - Question 3
Primary data is the collection of data collected by the investigator for his own purpose for the first time. These are collected from the source of origin.

The questionnaire is a structured technique for collecting primary data in a marketing survey. It is a series of written or verbal questions for which the respondent provides answers. A well-designed questionnaire motivates the respondent to provide complete and accurate information. Structured questionary is usually associated with quantitative research A structured questionnaire, on the other hand, is one in which the questions asked are precisely decided in advance.

Test: Collection, Organisation and Presentation of Data- Assertions & Reason Type Questions - Question 4

Directions : In the following questions, a statement of Assertion (A) is followed by a statement of Reason (R). Mark the correct choice as:

Assertion (A): Census Investigation method is a very costly method.

Reason (R): Census method involves surveying a large number of people and so it requires a lot of labour and manpower.

Detailed Solution for Test: Collection, Organisation and Presentation of Data- Assertions & Reason Type Questions - Question 4
It is a costly method since the statistician closely observes each and every item of the population. It is time-consuming since it requires a lot of manpower to collect the data. There are many possibilities of errors in a census investigation
Test: Collection, Organisation and Presentation of Data- Assertions & Reason Type Questions - Question 5

Directions : In the following questions, a statement of Assertion (A) is followed by a statement of Reason (R). Mark the correct choice as:

Assertion (A): Statistical error is the difference between the observed and the true value.

Reason (R): Statistical error can be sampling error and non-sampling error.

Detailed Solution for Test: Collection, Organisation and Presentation of Data- Assertions & Reason Type Questions - Question 5
The accuracy of a survey estimate refers to the closeness of the estimate to the true population value. Where there is a discrepancy between the value of the survey estimate and true population value, the difference between the two is referred to as the error of the survey estimate.
Test: Collection, Organisation and Presentation of Data- Assertions & Reason Type Questions - Question 6

Directions : In the following questions, a statement of Assertion (A) is followed by a statement of Reason (R). Mark the correct choice as:

Assertion (A): Sample Investigation method can be done very fast.

Reason (R): A very small sample is surveyed and used for investigation in the Sample Investigation Method.

Detailed Solution for Test: Collection, Organisation and Presentation of Data- Assertions & Reason Type Questions - Question 6

The correct answer is:

b) Both Assertion (A) and Reason (R) are true, and Reason (R) is the correct explanation of Assertion (A).

Explanation:

  • Assertion (A) states that the Sample Investigation method can be done very fast, which is true because this method typically involves surveying a smaller subset of the population.
  • Reason (R) explains that this is because a very small sample is surveyed and used for investigation, which is also true and indeed explains why the method is faster. A smaller sample size reduces the time required for data collection and analysis, making the process quicker. Therefore, the Reason (R) correctly explains the Assertion (A).
Test: Collection, Organisation and Presentation of Data- Assertions & Reason Type Questions - Question 7

Directions : In the following questions, a statement of Assertion (A) is followed by a statement of Reason (R). Mark the correct choice as:

Assertion (A): When inclusive series is given, it needs to be changed into exclusive series.

Reason (R): It is easy to calculate using exclusive series.

Detailed Solution for Test: Collection, Organisation and Presentation of Data- Assertions & Reason Type Questions - Question 7

The Correct Option is B.

Explanation:
Assertion (A): When inclusive series is given, it needs to be changed into exclusive series.

  • This statement is true. An inclusive series is a type of data series that includes the upper limit of each class interval, while an exclusive series excludes the upper limit. When working with statistical data, it is often necessary to convert an inclusive series into an exclusive series, as this can simplify calculations and make the data easier to understand and interpret.

Reason (R): It is easy to calculate using exclusive series.

  • This statement is also true. Exclusive series are often easier to work with than inclusive series, particularly when performing calculations. This is because in an exclusive series, the upper limit of one class interval does not overlap with the lower limit of the next, which can prevent confusion and reduce the likelihood of errors.

However, the reason (R) is not the correct explanation for the assertion (A). The need to change an inclusive series into an exclusive series is not solely because it is easier to calculate using an exclusive series. It also has to do with the clarity of the data presentation and the avoidance of data overlapping which could potentially lead to misinterpretation. Therefore, option B is the correct answer: both Assertion (A) and Reason (R) are true, but Reason (R) is not the correct explanation of Assertion (A).

Test: Collection, Organisation and Presentation of Data- Assertions & Reason Type Questions - Question 8

Directions : In the following questions, a statement of Assertion (A) is followed by a statement of Reason (R). Mark the correct choice as:

Assertion (A): 0-10, 10-20, 20-30, 30-40 is an example of Class Intervals.

Reason (R): Class Intervals are the value of items shown between two limits in a grouped frequency distribution.

Detailed Solution for Test: Collection, Organisation and Presentation of Data- Assertions & Reason Type Questions - Question 8
The frequency of a class interval is the number of observations that occur in a particular predefined interval. So, for example, if 20 people aged 5 to 9 appear in our study's data, the frequency for the 5–9 interval is 20. The endpoints of a class interval are the lowest and highest values that a variable can take. Each class in a frequency distribution table is bounded by Class Limits. Class limits are the two ends of a class. The lowest value is called the

Lower Class Limit and the highest value the Upper Class Limit.

Test: Collection, Organisation and Presentation of Data- Assertions & Reason Type Questions - Question 9

Directions : In the following questions, a statement of Assertion (A) is followed by a statement of Reason (R). Mark the correct choice as:

Assertion (A): Data is classified in order to make them simple and brief.

Reason (R): It is easy to calculate the result with the help of classification of data in statistics.

Detailed Solution for Test: Collection, Organisation and Presentation of Data- Assertions & Reason Type Questions - Question 9

The Correct Option is B

Explanation:

  • Understanding Assertion (A):
    • The assertion is stating that data is classified in order to make it simpler and more concise.
    • In the field of statistics, data classification is indeed a crucial step. This process involves arranging the data into different groups or classes based on their similarities.
    • The main purpose of this is to make the data easier to understand and interpret. By grouping similar data together, it becomes less complex and more condensed, thus making it more manageable and easy to analyse.


  • Understanding Reason (R):
    • The reason suggests that it's easier to calculate the result with the help of data classification in statistics.
    • This is true as classifying data simplifies it and makes it more organized, thus reducing the complexity of calculations.
    • When data is classified and arranged in a systematic manner, it allows for easier computation, comparison, and analysis.


  • Relationship between Assertion (A) and Reason (R):
    • While both the assertion and the reason are true, the reason is not the correct explanation of the assertion.
    • The assertion talks about the simplification and brevity of data due to classification, while the reason talks about the ease of calculation due to classification.
    • Though these are both benefits of data classification, the ease of calculation (reason) is not the direct explanation of the simplification and brevity of data (assertion).
    • Therefore, the correct answer is B: Both Assertion (A) and Reason (R) are true, but Reason (R) is not the correct explanation of Assertion (A).
Test: Collection, Organisation and Presentation of Data- Assertions & Reason Type Questions - Question 10

Directions : In the following questions, a statement of Assertion (A) is followed by a statement of Reason (R). Mark the correct choice as:

Assertion (A): Ram made a table for all the expenditure he has incurred during a week to calculate the total amount spent by him.

Reason (R): Tables help in simplified calculation of the data in a systematic manner.

Detailed Solution for Test: Collection, Organisation and Presentation of Data- Assertions & Reason Type Questions - Question 10

The Correct Explanation is A.

Explanation:

  • The assertion (A) states that Ram made a table to record and calculate all the expenditures he has made throughout the week. This is a factual statement and is true since it's a plausible action that someone might take to manage their finances.
  • The reason (R) states that tables help in simplified calculation of the data in a systematic manner. This is also a true statement. Tables indeed simplify data calculation by presenting information in an organized and systematic format.
  • Moreover, the reason (R) is the correct explanation of the assertion (A) because Ram made a table to simplify the calculation of his weekly expenditure, which aligns with the statement that tables simplify data calculation in a systematic manner.

So, the correct answer is A: Both Assertion (A) and Reason (R) are true, and Reason (R) is the correct explanation of Assertion (A).

Test: Collection, Organisation and Presentation of Data- Assertions & Reason Type Questions - Question 11

Directions : In the following questions, a statement of Assertion (A) is followed by a statement of Reason (R). Mark the correct choice as:

Assertion (A): A table needs to be attractive and simple.

Reason (R): Tables are prepared to make the statistics very lengthy.

Detailed Solution for Test: Collection, Organisation and Presentation of Data- Assertions & Reason Type Questions - Question 11
A table is a data structure that organizes information into rows and columns. It can be used to both store and display data in a structured format. For example, databases store data in tables so that information can be quickly accessed from specific rows.
Test: Collection, Organisation and Presentation of Data- Assertions & Reason Type Questions - Question 12

Directions : In the following questions, a statement of Assertion (A) is followed by a statement of Reason (R). Mark the correct choice as:

Assertion (A): Tables are used to clarify the object of the investigation.

Reason (R): Tables are the systematic presentation of the data.

Detailed Solution for Test: Collection, Organisation and Presentation of Data- Assertions & Reason Type Questions - Question 12
It is a table that helps to represent even a large amount of data in an engaging, easy to read, and coordinated manner. The data is arranged in rows and columns. This is one of the most popularly used forms of presentation of data as data tables are simple to prepare and read.
Test: Collection, Organisation and Presentation of Data- Assertions & Reason Type Questions - Question 13

Directions : In the following questions, a statement of Assertion (A) is followed by a statement of Reason (R). Mark the correct choice as:

Assertion (A): Diagrammatic representation of data makes the data very simple and intelligible.

Reason (R): It helps in the proper analysis of the data and helps in the comparative study of the data.

Detailed Solution for Test: Collection, Organisation and Presentation of Data- Assertions & Reason Type Questions - Question 13
Diagrammatic data presentation makes it easier for a common man to understand the data. Diagrams are usually attractive and impressive and many newspapers and magazines use them frequently to explain certain facts or phenomena. Modern advertising campaigns also use diagrams. Diagrams make it easier to compare data.
Test: Collection, Organisation and Presentation of Data- Assertions & Reason Type Questions - Question 14

Directions : In the following questions, a statement of Assertion (A) is followed by a statement of Reason (R). Mark the correct choice as:

Assertion (A): Pie Chart is represented as a percentage of the data given.

Reason (R): Pie Chart is constructed using that percentage itself.

Detailed Solution for Test: Collection, Organisation and Presentation of Data- Assertions & Reason Type Questions - Question 14
A pie chart is a type of graph that represents the data in the circular graph. The slices of pie show the relative size of the data. It is a type of pictorial representation of data. A pie chart requires a list of categorical variables and the numerical variables. Here, the term “pie” represents the whole, and the “slices” represent the parts of the whole.
Test: Collection, Organisation and Presentation of Data- Assertions & Reason Type Questions - Question 15

Directions : In the following questions, a statement of Assertion (A) is followed by a statement of Reason (R). Mark the correct choice as:

Assertion (A): Bar graph is represented with the help of bars or rectangles.

Reason (R): Bar graphs can represent the data of single series and multiple series.

Detailed Solution for Test: Collection, Organisation and Presentation of Data- Assertions & Reason Type Questions - Question 15
A bar graph is a specific way of representing data using rectangular bars where the length of each bar is proportional to the value they represent. It is basically a graphical representation of data using bars of different heights.
Test: Collection, Organisation and Presentation of Data- Assertions & Reason Type Questions - Question 16

Directions : In the following questions, a statement of Assertion (A) is followed by a statement of Reason (R). Mark the correct choice as:

Assertion (A): Ogives can only be made with less than cumulative frequency distribution.

Reason (R): Ogive is a frequency distribution graph by plotting cumulative frequency distribution in a form of smooth curve.

Detailed Solution for Test: Collection, Organisation and Presentation of Data- Assertions & Reason Type Questions - Question 16
The cumulative frequency table, then the cumulative frequencies are plotted against the upper or lower limits of the corresponding class intervals. By joining the points the curve obtained is called a cumulative frequency curve or ogive.
Test: Collection, Organisation and Presentation of Data- Assertions & Reason Type Questions - Question 17

Directions : In the following questions, a statement of Assertion (A) is followed by a statement of Reason (R). Mark the correct choice as:

Assertion (A): The Class Interval needs to be continuous while drawing a Histogram.

Reason (R): Histogram is a rectangular diagram using frequency distributions which are joined to one another.

Detailed Solution for Test: Collection, Organisation and Presentation of Data- Assertions & Reason Type Questions - Question 17
A bar diagram easy to understand but what is a histogram? Unlike a bar graph that depicts discrete data, histograms depict continuous data. The continuous data takes the form of class intervals. Thus, a histogram is a graphical representation of a frequency distribution with class intervals or attributes as the base and frequency as the height.
Test: Collection, Organisation and Presentation of Data- Assertions & Reason Type Questions - Question 18

Directions : In the following questions, a statement of Assertion (A) is followed by a statement of Reason (R). Mark the correct choice as:

Assertion (A): Frequency Polygon cannot be created without plotting a Histogram.

Reason (R): Frequency Polygon is made by joining the mid-points with straight lines.

Detailed Solution for Test: Collection, Organisation and Presentation of Data- Assertions & Reason Type Questions - Question 18
A frequency polygon can be created from the histogram or by calculating the midpoints of the bins from the frequency distribution table. The midpoint of a bin is calculated by adding the upper and lower boundary values of the bin and dividing the sum by 2.
Test: Collection, Organisation and Presentation of Data- Assertions & Reason Type Questions - Question 19

Directions : In the following questions, a statement of Assertion (A) is followed by a statement of Reason (R). Mark the correct choice as:

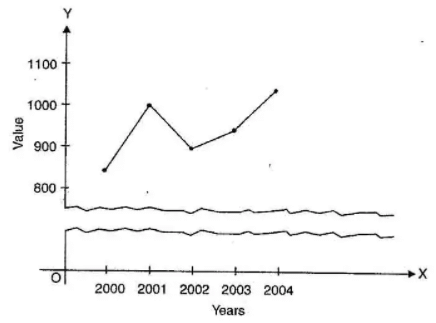
Assertion (A): False Base line is that portion of the scale which lies between zero and the smallest value of the variable is omitted.

Reason (R): One important rule in drawing the graph is that the vertical axis must start from zero.

Detailed Solution for Test: Collection, Organisation and Presentation of Data- Assertions & Reason Type Questions - Question 19
False Base Line is a device relating to graphical presentation. This line is used to break the continuity of Y-axis with the origin. A false base line is used when figures start with high values. If we maintain continuity of the value from the origin then sufficient portion of the graph would go waste. In the diagram given here, since all the values are confined between 800 and 1100. Therefore, in such a case, a false base line is used. After the false base line, we can start from the actual high figures as shown in the graph.

Test: Collection, Organisation and Presentation of Data- Assertions & Reason Type Questions - Question 20

Directions : In the following questions, a statement of Assertion (A) is followed by a statement of Reason (R). Mark the correct choice as:

Assertion (A): In graphical representation accuracy can be checked easily.

Reason (R): No mathematical knowledge is required for graphically representing the data.

Detailed Solution for Test: Collection, Organisation and Presentation of Data- Assertions & Reason Type Questions - Question 20

The Correct Option is D

Explanation:

  • Assertion (A): In graphical representation, accuracy can be checked easily.
    • This statement is true. Graphical representation of data allows for an immediate overview of the data's patterns, trends and fluctuations. This visual representation makes it much easier to understand and interpret the data, thus enhancing the accuracy of any conclusions drawn. It also allows for immediate detection of any errors, outliers, or abnormalities in the data.


  • Reason (R): No mathematical knowledge is required for graphically representing the data.
    • This statement is false. While it is true that graphical representation can make data more understandable to people without advanced mathematical knowledge, the process of creating these graphs does require some mathematical skills. Understanding of scales, axes, coordinates, proportions, and sometimes even more advanced concepts like statistical distributions, are required to accurately represent data graphically.


Therefore, the correct answer is C: Assertion (A) is true, but Reason (R) is false.

75 videos|274 docs|46 tests
Information about Test: Collection, Organisation and Presentation of Data- Assertions & Reason Type Questions Page
In this test you can find the Exam questions for Test: Collection, Organisation and Presentation of Data- Assertions & Reason Type Questions solved & explained in the simplest way possible. Besides giving Questions and answers for Test: Collection, Organisation and Presentation of Data- Assertions & Reason Type Questions, EduRev gives you an ample number of Online tests for practice

Top Courses for Commerce

75 videos|274 docs|46 tests
Download as PDF

Top Courses for Commerce