SAT Exam  >  SAT Tests  >  Mathematics for Digital SAT  >  Test: Data Analysis - 2 - SAT MCQ

Test: Data Analysis - 2 - SAT MCQ


Test Description

15 Questions MCQ Test Mathematics for Digital SAT - Test: Data Analysis - 2

Test: Data Analysis - 2 for SAT 2024 is part of Mathematics for Digital SAT preparation. The Test: Data Analysis - 2 questions and answers have been prepared according to the SAT exam syllabus.The Test: Data Analysis - 2 MCQs are made for SAT 2024 Exam. Find important definitions, questions, notes, meanings, examples, exercises, MCQs and online tests for Test: Data Analysis - 2 below.
Solutions of Test: Data Analysis - 2 questions in English are available as part of our Mathematics for Digital SAT for SAT & Test: Data Analysis - 2 solutions in Hindi for Mathematics for Digital SAT course. Download more important topics, notes, lectures and mock test series for SAT Exam by signing up for free. Attempt Test: Data Analysis - 2 | 15 questions in 25 minutes | Mock test for SAT preparation | Free important questions MCQ to study Mathematics for Digital SAT for SAT Exam | Download free PDF with solutions
Test: Data Analysis - 2 - Question 1

Comprehension:

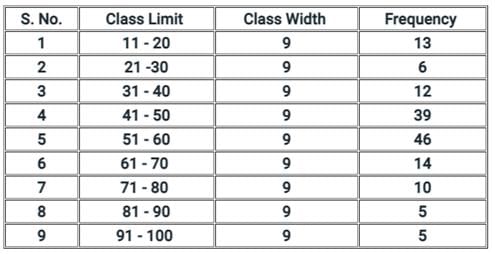
Directions: Consider the following data and answer questions:
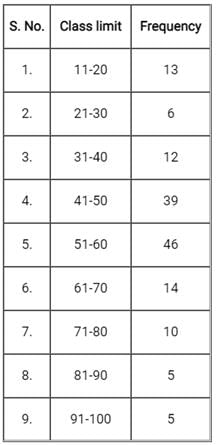
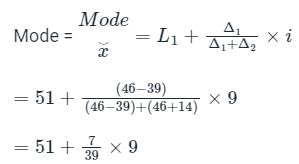
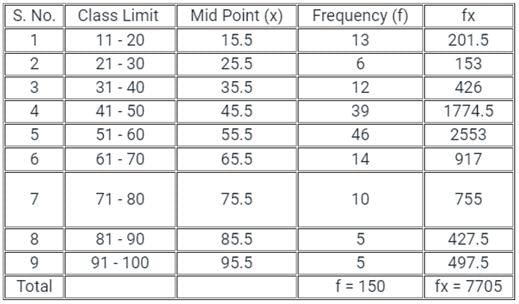
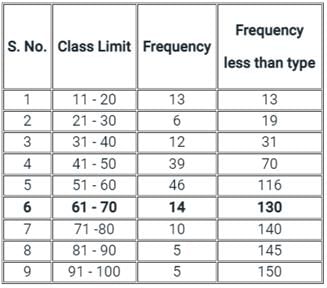
Which one of the following is the mode value for the given data set?

Detailed Solution for Test: Data Analysis - 2 - Question 1

Key Points:

  • ​In statistics, the mode is the value that is repeatedly occurring in a given set. We can also say that the value or number in a data set, which has a high frequency or appears more frequently, is called mode or modal value. It is one of the three measures of central tendency, apart from mean and median. For example, the mode of the set {3, 7, 8, 8, 9}, is 8.
  • Therefore, for a finite number of observations, we can easily find the mode. A set of values may have one mode or more than one mode or no mode at all.


= 52.61

where,

L1 = Lower class boundary of modal class

Δ= Difference of frequency density between modal and pre. modal class

Δ2 = Difference of frequency density between modal and Post modal class

(i) width of the modal class.

Test: Data Analysis - 2 - Question 2

Comprehension:

Directions: Consider the following data and answer questions:
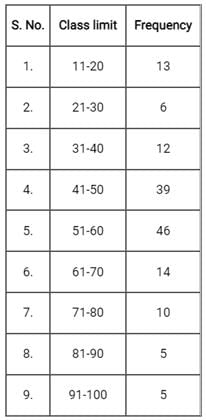
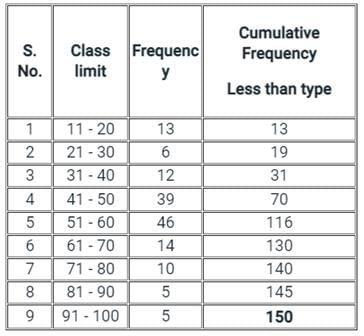
Which one of the following is the cumulative frequency of the entire data set?

Detailed Solution for Test: Data Analysis - 2 - Question 2

Key Points

  • In Statistics, a cumulative frequency is defined as the total of frequencies, that are distributed over different class intervals. It means that the data and the total are represented in the form of a table in which the frequencies are distributed according to the class interval.
  • The cumulative frequency is calculated by adding each frequency from a frequency distribution table to the sum of its predecessors. The last value will always be equal to the total for all observations since all frequencies will already have been added to the previous total.
  •  A table that displays the cumulative frequencies that are distributed over various classes is called a cumulative frequency distribution or cumulative frequency table.
  • There are two types of cumulative frequency - lesser than type and greater than typical. Cumulative frequency is used to know the number of observations that lie above (or below) a particular frequency in a given data set. Let us look at a few examples that are used in many real-world situations.

  • In general the cumulative frequency( less than) type is considered as a cumulative frequency for the whole dataset.
  • Therefore the cumulative frequency of the entire dataset is 150.
1 Crore+ students have signed up on EduRev. Have you? Download the App
Test: Data Analysis - 2 - Question 3

Comprehension:

Directions: Consider the following data and answer questions:
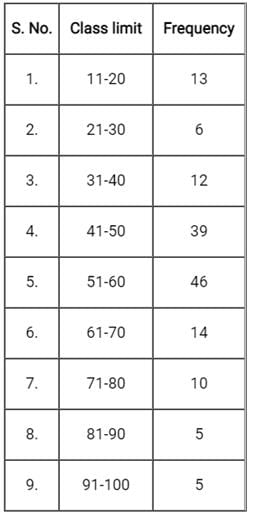
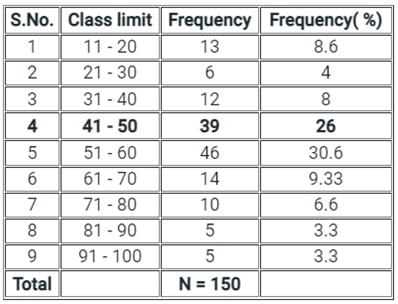
Which one of the following is the relative frequency in percentage for class limit 41-50 from the given data set?

Detailed Solution for Test: Data Analysis - 2 - Question 3
  • Relative frequency can be defined as the number of times an event occurs divided by the total number of events occurring in a given scenario. The relative frequency formula is given as Relative Frequency = Subgroup frequency/ Total frequency.
  • Relative Frequency = f/ n*100, where, f is the number of times the data occurred in an observation. n = total frequencies.
  • Relative frequency is simply the class frequency (fi) It is expressed as a proportion of the total frequency (N) of a given distribution. It is sometimes measured as a percentage of the total frequency. The sum of all relative frequencies in a given distribution is equal to the total frequency.


Therefore the relative frequency for class limits 41 - 50 is 39, and it is 26% of the total frequency.

Test: Data Analysis - 2 - Question 4

Which of the following is a data visualization method?

Detailed Solution for Test: Data Analysis - 2 - Question 4

Key Points:

Data visualization method:

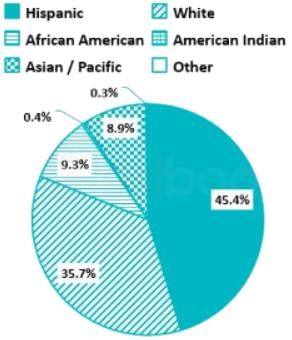
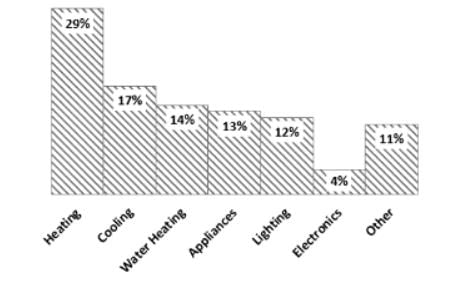
  • It is a graphical method of presenting data
  • For this purpose, we use graphical elements like graphs, charts, maps, etc.
  • Visualizations tools can be selected based on the size and type of data

​1. Pie charts:

  • It is a circle and sector diagram
  • The values are shown as part of a 3600 circle
  • The values are converted into percentage values before plot them into the chart 

2. Bar charts:

  • It uses to show mainly the frequency distribution graphically
  • Sometimes we plot the percentage values

Additional Information

  • Line, circle, triangle, and pentagon are shapes 
  • Line graph, circle and triangle diagram, pentagon graph, etc, are used to represent different data of different format
Test: Data Analysis - 2 - Question 5

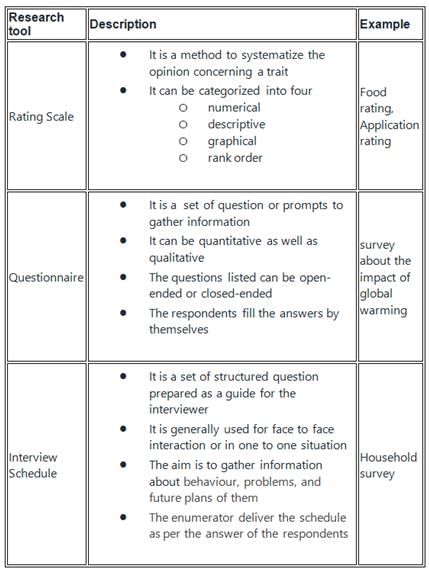
In order to understand the classroom teaching-learning process, which of the following research tool is most appropriate?

Detailed Solution for Test: Data Analysis - 2 - Question 5

In order to understand the classroom teaching-learning process Observation Schedule is most appropriate.

Observation Schedule:

  • Here the data is collected based on observation
  • It could be structured or unstructured method, controlled or uncontrolled observation 
  • The observer could be a member of the observer group. Sometimes they are playing the role of the observer only.
  • It is inexpensive
  • Suitable to get current information
  • Subjects are easily available
  • The work can be started or stopped at any time 
  • For example, understand the classroom teaching-learning process

Additional Information

Test: Data Analysis - 2 - Question 6

If you want to compare the price of wheat over a period, which index will you use?

Detailed Solution for Test: Data Analysis - 2 - Question 6

Price Index:

  • Price index is an economic variable that is used to measure the price changes for commodities.
  • It helps in measuring the relative price changes, consisting of a series of numbers so that comparison can be done over a period of time.
  • It is a valuable economic measure used to check the average differences in prices.
  • It was necessarily developed to determine the wage changes in order to see the effect on the standard of living.
  • The index is still widely used to measure the cost differences across different countries.

Additional Information

1. Volume Index:

  • A volume index is most commonly presented as a weighted average of the proportionate changes in the quantities of a specified set of goods or services between two periods of time; volume indices may also compare the relative levels of activity in different countries.

2. Aggregate Index:

  • Aggregate index is calculated by adding all elements in the composite for the given period and then dividing this result by the sum of the elements during the base period.
Test: Data Analysis - 2 - Question 7

Which among the following is a software for the analysis of qualitative data?

Detailed Solution for Test: Data Analysis - 2 - Question 7

Qualitative Data Analysis Software is a system that helps with a wide range of processes that help in content analysis, transcription analysis, discourse analysis, coding, text interpretation, recursive abstraction, grounded theory methodology, and interpreting information so as to make informed decisions.

Key Points

NVivo software:

  • NVivo is a software program used for qualitative and mixed-methods research.
  • Specifically, it is used for the analysis of unstructured text, audio, video, and image data, including (but not limited to) interviews, focus groups, surveys, social media, and journal articles.
  • It is produced by QSR International. As of July 2014, it is available for both Windows and Macintosh operating systems

Additional Information

R is a programming language for statistical computing and graphics.

  • It compiles and runs on a wide variety of UNIX platforms, Windows and MacOS.
  • Qualitative data analysis tools can help organize, process, and analyze data for actionable insights. 
  • Qualitative data analysis software is used across a wide range of sectors and industries such as healthcare, the legal industry, e-commerce businesses,

SPSS is a software program. it stands for Statistical Package for the Social Sciences, and it's used by various kinds of researchers for complex statistical data analysis.

  • The SPSS software package was created for the management and statistical analysis of social science data.

STATA is a powerful statistical software developed by StataCorp for data manipulation, visualization, statistics, and automated reporting.

  • It enables users to analyze, manage, and produce graphical visualizations of data.
  • It is primarily used by researchers in the fields of economics, biomedicine, and political science to examine data patterns.
Test: Data Analysis - 2 - Question 8

Which of the following is the most unstable average?

Detailed Solution for Test: Data Analysis - 2 - Question 8
  • Mode: The word mode has been derived from the French word “la Mode” which signifies the most fashionable values of distribution because it is repeated the highest number of times in the series. The mode is the most frequently observed data value. It is denoted by Mo.
    • The mode is seldom used and its computation is easy, but it is highly unstable and may change with minor shifts in the frequencies from one interval to another. 
    • However, there are situations in which the only mode can be used. 
    • For example, if a shoe company wants to how which size of shoe it should produce more, it would use mode as a measure of central tendency. The most frequently sold size of the shoes is the mode.
  • Arithmetic mean: The arithmetic mean is the most commonly used measure of central tendency. The mean represents the central tendency. It is defined as the sum of the values of all observations divided by the number of observations and is usually denoted by X. In general, if there are N observations as X1, X2, X3, ..., XN, then the Arithmetic Mean is given by


    This will be written in simpler form without the index i.
    Thus mean = N ∑ X/N where, ΣX = sum of all observations and N = total number of observations. 
  • Median is that positional value of the variable which divides the distribution into two equal parts, one part comprises all values greater than or equal to the median value and the other comprises all values less than or equal to it. The Median is the “middle” element when the data set is arranged in order of the magnitude. Since the median is determined by the position of different values, it remains unaffected if, say, the size of the largest value increases. The median can be easily computed by sorting the data from smallest to largest and finding out the middle value.

Hence, we conclude that Mode is the most unstable average.

Test: Data Analysis - 2 - Question 9

Comprehension:

Directions: Consider the following data and answer questions:
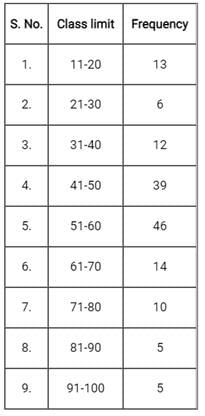
Which one of the following is the arithmetic mean value for the given data set?

Detailed Solution for Test: Data Analysis - 2 - Question 9

Key Points

  • Arithmetic mean represents a number that is obtained by dividing the sum of the elements of a set by the number of values in the set. So you can use the layman's term Average, or be a little bit fancier and use the word “Arithmetic mean” your call, take your pick -they both mean the same.
  • The arithmetic mean may be either- Simple Arithmetic Mean, or Weighted Arithmetic Mean.


Test: Data Analysis - 2 - Question 10

Comprehension:

Directions: Consider the following data and answer questions:
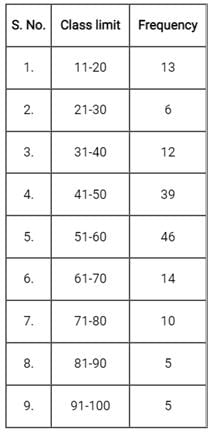
Which one of the following is the cumulative frequency for the class limit 61-70 from the given data set?

Detailed Solution for Test: Data Analysis - 2 - Question 10

Key Points

  • Cumulative frequency analysis is the analysis of the frequency of occurrence of values of a phenomenon less than a reference value.
  • The phenomenon may be time- or space-dependent. Cumulative frequency is also called the frequency of non-exceedance.
  • Technically, a cumulative frequency distribution is the sum of the class and all classes below it in a frequency distribution. All that means is you’re adding up a value and all of the values that came before it.

  • Therefore the cumulative frequency of the entire dataset is 150.
  • The cumulative frequency for the class limit 61 - 70 is 130.
Test: Data Analysis - 2 - Question 11

In Data Processing, what does the abbreviation SAP stand for?

Detailed Solution for Test: Data Analysis - 2 - Question 11

Important Points

  • SAP is one of the world’s leading producers of software for the management of business data processes.
  • SAP provides “future-proof Cloud ERP solutions that will power the next generation of business”.
  • SAP can boost your organization's efficiency and productivity by automating repetitive tasks, making better use of your time, money, and resources.

Key Points

  • An SAP number is a unique six-digit number used by a municipality to identify a vendor in its system.
Test: Data Analysis - 2 - Question 12

Which one of the following is a non‐parametric statistic?

Detailed Solution for Test: Data Analysis - 2 - Question 12

The non-parametric approach is a statistical method that makes no assumptions about the sample's characteristics (its parameters) or whether the observed data is quantitative or qualitative.

Key Points:

  • Certain descriptive statistics, statistical models, inference, and statistical tests are examples of nonparametric statistics. 
  • The model structure of nonparametric approaches is determined from data rather than being established a priori.
  • The normal distribution model and the linear regression model are examples of nonparametric statistics.
  • Ordinal data is sometimes used in nonparametric statistics which means it does not rely on numbers but rather on a ranking or order of sorts.
  • The Spearman rank-order correlation coefficient is a nonparametric statistics measure of the strength and direction of the relationship between two variables assessed on an ordinal scale.
  • The test is used for ordinal variables or continuous data that fails to meet the assumptions required for the Pearson's product-moment correlation to be conducted.

​Thus, Spearman's correlation is a non‐parametric statistic. 

Additional Information:

  • F‐ statistic: An F-test is any statistical test in which the test statistic has an F-distribution under the null hypothesis. The F statistic simply compares the combined effect of all variables. 
  • t ‐ statistic: The t-value expresses the magnitude of the difference in terms of the variation in your sample data. 
  • Pearson's correlation: This correlation coefficient is a single number that measures both the strength and direction of the linear relationship between two continuous variables.
Test: Data Analysis - 2 - Question 13

Which company was recently implicated in a global data theft crime?

Detailed Solution for Test: Data Analysis - 2 - Question 13

Key Points

  • Cambridge Analytica company was recently implicated in a global data theft crime.
  • Cambridge Analytica started in 2013 as a British Political Consulting which use to combine data mining, data analysis, and data brokerage for strategic communication during elections.
  • CEO of Cambridge Analytica is Alexander Nix.

Additional Information

Some important events in which Cambridge Analytica was involved:

  • 2014 => Involved in 44 US political race.
  • 2015 => Performed data analysis services for Ted Cruz's presidential campaign.
  • 2016 => Worked for Donald Trump's presidential campaign.
  • 2016 => Worked for Leave European Union.
  • March 2018 => many newspaper publishers reported that CA (Cambridge Analytica) is using the personal data of Facebook users for academic purposes and collecting them.
Test: Data Analysis - 2 - Question 14

A researcher administers an achievement test to assess and indicate the possible effect of an independent variable in his/her study. The distribution of scores on the test is found to be negatively skewed. On the basis of this, what can be started with regard to the difficulty level of the test?

Detailed Solution for Test: Data Analysis - 2 - Question 14

Skewness refers to distortion or asymmetry in a symmetrical bell curve, or normal distribution, in a set of data. If the curve is shifted to the left or to the right, it is said to be skewed. Skewness can be quantified as a representation of the extent to which a given distribution varies from a normal distribution.

Key Points:

Negative Skewness: Negatively skewed distribution refers to the distribution type where more values are plotted on the right side of the graph, where the tail of the distribution is longer on the left side and the mean is lower than the median and mode which it might be zero or negative due to the nature of the data as negatively distributed. Mode  >  Median  > Mean.

For Example, university exams; exams are the same, but a few scores less, a few score average, and a few scores the high percentage, which shows the data is negatively skewed as there is unequal distribution.

An easy test will result in a left-skewed (negatively skewed) distribution of the scores. Thus, the tail of that score distribution will be the lower marks which are on the left-hand side.

This is basically because the frequency of higher scores will be far more than the frequency of low scores, if any, given that the test is an easy one.

Essentially the mode (peak) will be that of a higher score, whereas the median score will be lower than the modal score, and then the mean score which will be the least of all three scores. These are characteristics associated with the left-skewed distribution.

Thus, option A is the correct answer.

In short, easy tests tend to yield negatively skewed score distributions and hard tests tend to yield positively skewed distributions

Test: Data Analysis - 2 - Question 15

A statistical measure that indicates the extent to which changes in one factor are accompanied by changes in another 

Detailed Solution for Test: Data Analysis - 2 - Question 15

Correlation coefficient: If the change in one variable appears to be accompanied by a change in the other variable, the two variables are said to be co-related and this inter-variation is called correlation.

  • For example, if you want to study the relationship between height and weight - whether the change in one will bring a change in other or not. Or if you want to find the relationship between hours of study and achievement, sex and enrolment, etc., you can do so by finding a correlation between them.
  • The degree of association or the degree of relationship between two variables is measured quantitatively in the form of an index which is termed as co-efficient of correlation.
  • The coefficient of correlation is a single number that tells us to what extent the two variables are related and to what extent the variations in one variable changes with the variations in the other. 

Hence, we conclude that the above statement is about the Correlation coefficient.

185 videos|124 docs|75 tests
Information about Test: Data Analysis - 2 Page
In this test you can find the Exam questions for Test: Data Analysis - 2 solved & explained in the simplest way possible. Besides giving Questions and answers for Test: Data Analysis - 2, EduRev gives you an ample number of Online tests for practice

Top Courses for SAT

185 videos|124 docs|75 tests
Download as PDF

Top Courses for SAT