Test: Data Insights - 5 - GMAT MCQ
20 Questions MCQ Test GMAT Mock Test Series 2025 - Test: Data Insights - 5

Q. Which one of the following procedures, when applied to the last mathematical expression in the Concise Solution tab, gives a mathematical expression that answers the question asked in the Problem Statement tab?
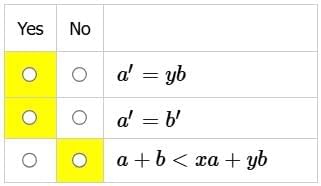
A given number is a possible value of a’ if, for each value of x in the Table tab, there is a value of a that is compatible with that value of x and the other information provided. For each of the following numbers, choose Yes if, given this condition, it is a possible value of a' Otherwise choose No.


Assume the information provided is true. For each of the following mathematical statements, choose Yes if, according to the information provided, the statement is true for the possible values of x and y. Otherwise choose No.
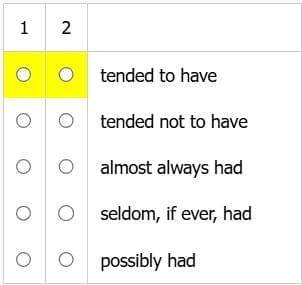
At a certain university, there is a strong positive correlation between the time of day at which university classes are offered and the classes' average (arithmetic mean) grades, with earlier times associated with lower grades. However, for the classes offered at the earliest time but not for any other classes, there was a strong negative correlation between the grades of students in those classes and the number of scheduled classes they missed. In fact, when the grades of students who missed at least 5 scheduled classes were excluded, classes offered at the earliest time more often than not had significantly higher average grades than classes offered at any other time. Consider the following statement:
At the university in question, classes offered at earlier times ____1____ lower average grades than classes offered later in the day, but when the grades of students who missed at least 5 scheduled classes were excluded, classes offered at the earliest time ____2____ higher average grades than classes offered later in the day.
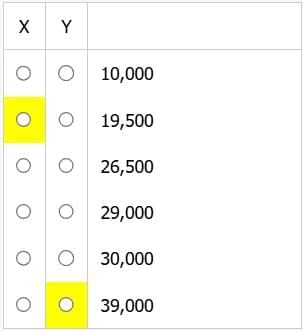
The total population of a town, Burex, last year was 200,500, out of which 40% were above 40 years. This year, the number of people above 40 years is 110,000, which is 50% of total population.
Select for X, the number of people who were part of the population last year but not this year, and select for Y, the number of people who are part of the population this year but not last year, such that both X and Y are consistent with the given information.
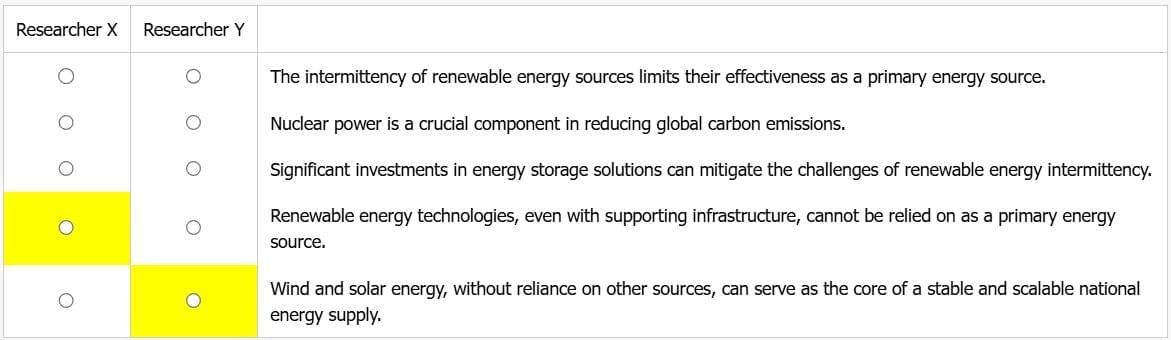
Researcher X: The development of renewable energy technologies, such as wind and solar power, should be our primary focus in combating climate change. These technologies offer clean, limitless energy and are becoming more cost-effective each year. However, their intermittent nature—solar power being dependent on sunlight and wind power on wind conditions—means that significant investments in energy storage systems and grid infrastructure are needed to make renewable energy a reliable primary source.
Researcher Y: While renewable energy technologies are important, they are not sufficient on their own to meet global energy demands or meaningfully address climate change in the short term. Continued investment in nuclear power is essential. Nuclear energy provides a consistent and substantial supply of low-carbon energy and, unlike wind and solar, does not suffer from intermittency and can reliably serve as a base load energy source.
From the options below, select for Researcher X the statement that Researcher X would most likely disagree with, and select for Researcher Y the statement that Researcher Y would most likely disagree with.
Pipe A, working alone at its constant rate, starts filling an empty pool and then stops. Subsequently, Pipe B, working alone at its constant rate, completes the task and fills the remaining part of the pool. If the entire filling process took 7 hours, and Pipe A pumped in three times as much water as Pipe B, how many hours will it take Pipe B, working alone at its constant rate, to fill the entire pool on its own?
(1) After 4 hours, half of the pool was filled.
(2) Working together at their respective constant rates, Pipes A and B can fill the empty pool in one-third of the time it takes Pipe A, working alone at its constant rate.
A worker is hired for 7 days. Each day, he is paid 11 dollars more than what he is paid for the preceding day of work. How much was he paid in total for the 7 days of work?
(1) The total amount he was paid in the first 4 days of work equaled the total amount he was paid in the last 3 days.
(2) The total amount he was paid in the last 3 days of work equaled $66 more than the total amount he was paid in the first 3 days of work.
The median age of seven children in group A was 13. The median age of nine children in group B was 9. Four children — the youngest and the oldest in each group — were exchanged between the groups. What was the new median age of the children in group B?
(1) Before the exchange, the oldest child in group B was 12 years old.
(2) Before the exchange, the youngest child in group A was 8 years old.
As a salesperson, Brandon's compensation is structured so that each month he earns a $5000 base salary plus 10% of his total sales above $10000 for the month. What were Brandon's total sales for the month of August?
(1) Had Brandon sold $10000 more than he did in August, his total compensation for the month would have been equal to 15% of his sales.
(2) Had Brandon sold $40000 less than he did in August, his total compensation for the month would have been equal to 10% of his sales.
It has been proposed that teenagers aged 10 to 15 years be restricted to less than 2 hours per day engaging with social media. Would a significant number of teens aged 10 to 15 years get an overall developmental or health benefit from such a restriction?
(1) A peer-reviewed study indicates a 23% increase in the incidence of chronic anxiety or depression among teenagers aged 10 to 15 years who average 2 or more hours per day engaging with social media.
(2) Certain kinds of engagement with social media averaging 2 or more hours per day by teenagers aged 10 to 15 years lead, in about 28% of cases, to meaningful friendships and social and emotional learning, both of which are valuable for development at those ages.
Of the 100 flowers in a garden, 3/4 are either roses or tulips and 3/25 are either lilies or tulips. If there is at least one rose, at least one tulip, and at least one lily in the garden, how many of the flowers are tulips?
(1) The ratio of the number of roses to the number of tulips is less than 13 to 2.
(2) 13/20 of the flowers in the garden are either roses or lilies.
![]()
Angela borrowed P dollars at 6 percent annual interest compounded monthly, and she will repay the loan by making n monthly payments of M dollars each. The formula gives the relationship between P, M and n. Is M > 50?
(1) P = 10,000
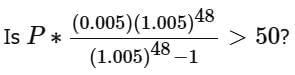
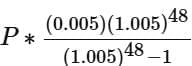
(2) n = 48
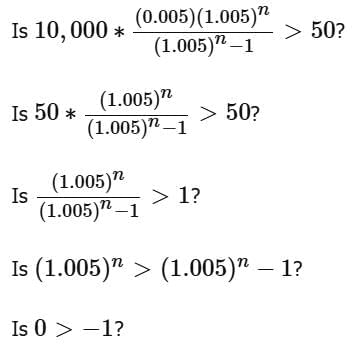
 can be more than (or equal to) 50 as well as less than 50, depending on the value of P. Hence, this statement is not sufficient.
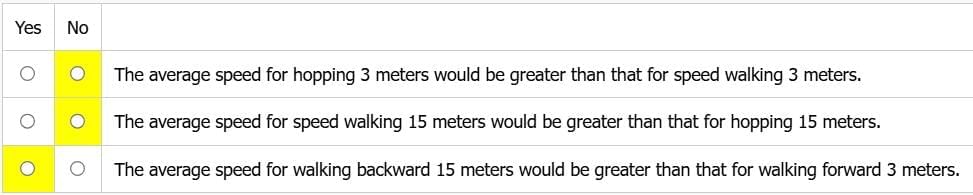
In a school experiment, students timed each other as they went various distances using various gaits, or ways of moving on foot. The table shows their average speeds using each gait to go 5 meters and 10 meters. The students' assumption is that, for each gait, there is a perfectly linear relationship between distance and average speed (i.e., the relationship can be accurately represented by data points on a straight line) for distances between 3 meters and 15 meters, respectively.

For each of the following predictions, choose option if, given the students' assumption, the data in the table provide sufficient support for the prediction.
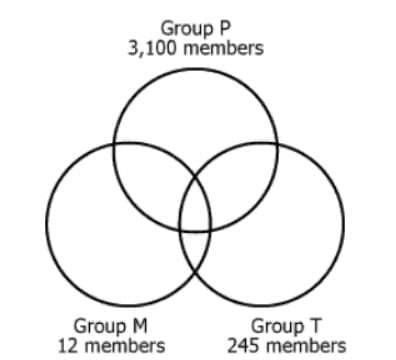
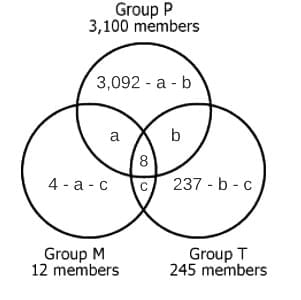
The diagram shows the relationships between 3 groups of stockholders of Company HQS and the number of stockholders in each group
Group P consists of those stockholders who receive a paper copy of the annual report.
Group M consists of the majority stockholders.
Group T consists of those stockholders who are traders
Exactly 8 stockholders belong to all three groups. It is possible that one or more of the regions in the diagram do not contain any members.
Select from each drop-down menu the option that creates the most accurate statement based on the information provided.
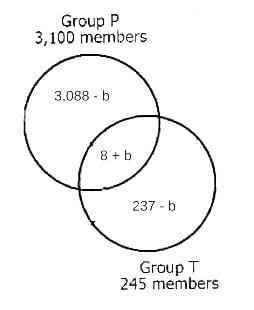
If all majority stockholders receive paper reports, then __(A)____ is the maximum number of traders who could receive paper reports.
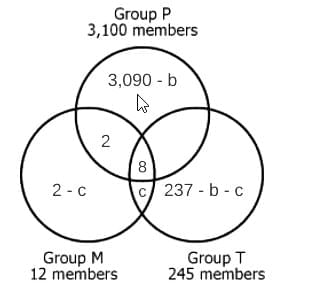
If exactly 10 majority stockholders receive paper reports, then __(B)____ is the maximum number of traders who could also be majority stockholders.
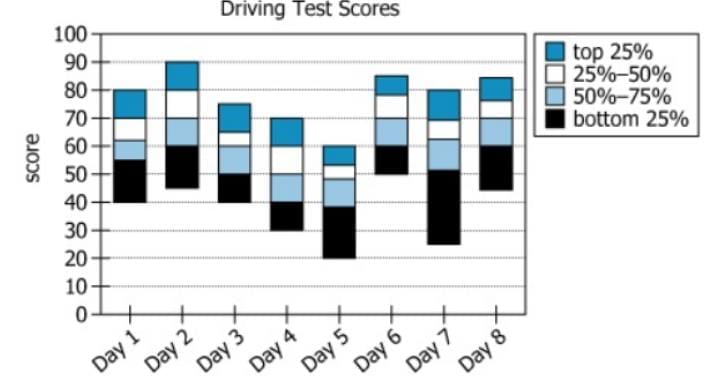
The graph shows the distributions of scores on official driving tests administered within a certain municipality for eight consecutive business days.
Select from given options that creates the most accurate statement, given the information provided.
The graph provides enough information to determine that the __(A)___ over all of the days indicated in the graph is the same as that for ___(B)___ combined.
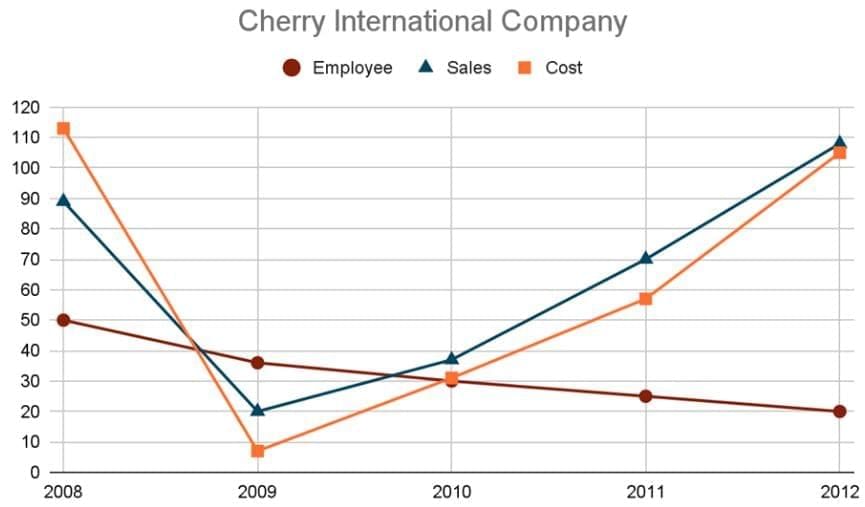
Cherry International Company is a leading business firm dealing in various products. The graph above shows the change in the strength of employees, sales and cost incurred by the company over a period of 5 years.
Profit of the company is the difference in sales and cost, that is Profit = Sales-Cost.
The values of cost and sales in Billion dollars and the number of employees in thousands. So, 20 thousand employees were working in the year 2012, while the sales of the company and the cost incurred by the company were $ 108 billion and $ 105 billion respectively.
From each drop down menu, select the option that creates the most accurate statement based on the graph and information above.
The profit per employee is the highest in __(A)___, while the maximum percentage change in the cost has been in ___(B)____
Amy attempts 5 math tests, each test consisting of 50 multiple-choice questions worth 2 points each. Questions are based on the following topics: Geometry, Algebra and Combinatorics. No question is based on more than one topic. She notices that the total number of points per topic is the same across the 5 tests. She scores the maximum possible points for each topic in at least one of the tests. Given below are her test scores based on each topic across the 5 tests.
As a percentage of the total points scored across the 5 tests, approximately ____(A)____ more percent points did Amy lose in Algebra than in Geometry?
For any given test, find the approximate difference ____(B)____ between the greatest possible percentage increase in score and the least possible percentage increase in score.
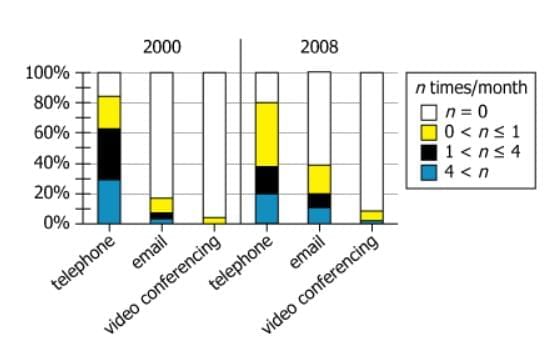
The graph shows data for physicians who, in 2000 and 2008, were surveyed about the average number of times per month they used each of 3 methods (telephone, email, and video conferencing) to communicate with their patients. The bars represent the percentage of the respondents who reported using the indicated method the indicated number of times per month.
Select from options that completes the statement so that it most accurately reflects the information provided.
It must be the case that the median number of times per month respondents reported having communicated with patients by __(A)___ in the 2008 survey was less than that in the 2000 survey.
It must be the case that the percentage of respondents who reported having communicated with patients by both ___(B)___ was as great or greater in the 2008 survey as it was in the 2000 survey.
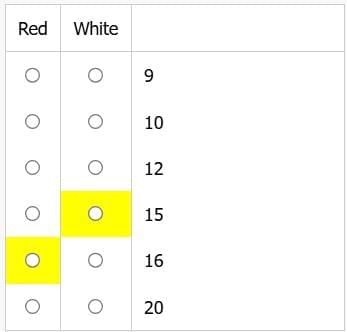
A bag contains only red and white balls. The probability of drawing two red balls consecutively is 2/5. However, when 6 red balls are replaced with 6 white balls, the probability of drawing two consecutive red balls decreases to 3/25.
Select the option of red balls in the bag prior to the replacement under "Red" and the number of white balls in the bag after the replacement under "White". Make only two selections, one from each column.
|
18 docs|33 tests
|


Important Questions for Data Insights - 5
Data Insights - 5 MCQs with Answers
Online Tests for Data Insights - 5 GMAT Mock Test Series 2025
|
© EduRev
|
Education Revolution
|


|


