Test: Data Tabulation & Caselets - 2 - CAT MCQ
15 Questions MCQ Test - Test: Data Tabulation & Caselets - 2

Directions for Questions: Answer the questions on the basis of the information given below.
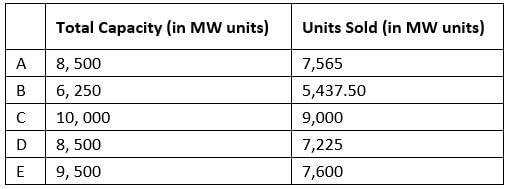
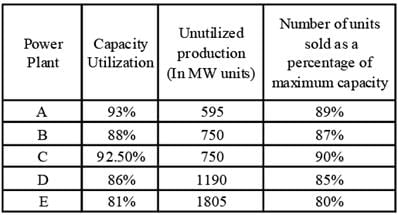
The total electricity production of five thermal power plants in India in year 2009-10 is given in the table below. Capacity utilization for any power plant is the percentage of maximum capacity, of that power plant, which is used for power production.
Maximum capacity (100%) = Capacity utilization (In %) + Unutilized production (In %)
(2015)


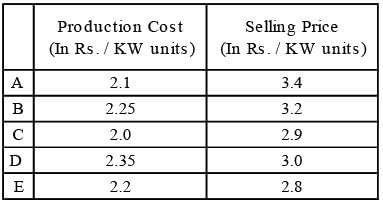
Total cost of production = Units Produced (in KW) × Production Cost (in Rs. / KW units)
Total Revenue = Units Sold (in KW) × Selling price (in Rs. / KW units)
Profitability = (Revenue - Cost / Cost) × 100
Q. Which of the following represents the decreasing order of units sold by the given 5 power plants?
The total electricity production of five thermal power plants in India in year 2009-10 is given in the table below. Capacity utilization for any power plant is the percentage of maximum capacity, of that power plant, which is used for power production.
Maximum capacity (100%) = Capacity utilization (In %) + Unutilized production (In %)
Total cost of production = Units Produced (in KW) × Production Cost (in Rs. / KW units)
Total Revenue = Units Sold (in KW) × Selling price (in Rs. / KW units)
Profitability = (Revenue - Cost / Cost) × 100

Directions for Questions: Answer the questions on the basis of the information given below.
The total electricity production of five thermal power plants in India in year 2009-10 is given in the table below. Capacity utilization for any power plant is the percentage of maximum capacity, of that power plant, which is used for power production.
Maximum capacity (100%) = Capacity utilization (In %) + Unutilized production (In %)
(2015)


Total cost of production = Units Produced (in KW) × Production Cost (in Rs. / KW units)
Total Revenue = Units Sold (in KW) × Selling price (in Rs. / KW units)
Profitability = (Revenue - Cost / Cost) × 100
Q. Which of the following statements is true?
The total electricity production of five thermal power plants in India in year 2009-10 is given in the table below. Capacity utilization for any power plant is the percentage of maximum capacity, of that power plant, which is used for power production.
Maximum capacity (100%) = Capacity utilization (In %) + Unutilized production (In %)
Total cost of production = Units Produced (in KW) × Production Cost (in Rs. / KW units)
Total Revenue = Units Sold (in KW) × Selling price (in Rs. / KW units)
Profitability = (Revenue - Cost / Cost) × 100

Directions for Questions: Answer the questions on the basis of the information given below.
The total electricity production of five thermal power plants in India in year 2009-10 is given in the table below. Capacity utilization for any power plant is the percentage of maximum capacity, of that power plant, which is used for power production.
Maximum capacity (100%) = Capacity utilization (In %) + Unutilized production (In %)
(2015)
Total cost of production = Units Produced (in KW) × Production Cost (in Rs. / KW units)
Total Revenue = Units Sold (in KW) × Selling price (in Rs. / KW units)
Profitability = (Revenue - Cost / Cost) × 100
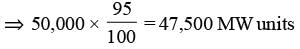
Q. In the given year, if capacity of power plant B had 12.5% of the total power capacity of India, and thermal power capacity of India is 95% of its total power capacity. The total capacity of these 5 thermal power plants was what percentage of the total thermal power capacity of India?
The total electricity production of five thermal power plants in India in year 2009-10 is given in the table below. Capacity utilization for any power plant is the percentage of maximum capacity, of that power plant, which is used for power production.
Maximum capacity (100%) = Capacity utilization (In %) + Unutilized production (In %)
Total cost of production = Units Produced (in KW) × Production Cost (in Rs. / KW units)
Total Revenue = Units Sold (in KW) × Selling price (in Rs. / KW units)
Profitability = (Revenue - Cost / Cost) × 100


Directions for Questions: Answer the questions on the basis of the information given below.
The total electricity production of five thermal power plants in India in year 2009-10 is given in the table below. Capacity utilization for any power plant is the percentage of maximum capacity, of that power plant, which is used for power production.
Maximum capacity (100%) = Capacity utilization (In %) + Unutilized production (In %)
(2015)


Total cost of production = Units Produced (in KW) × Production Cost (in Rs. / KW units)
Total Revenue = Units Sold (in KW) × Selling price (in Rs. / KW units)
Profitability = (Revenue - Cost / Cost) × 100
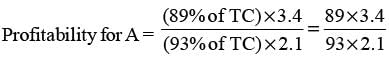
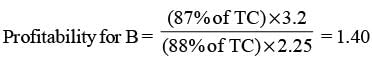
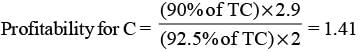
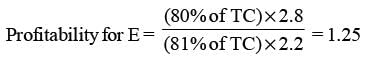
Q. Which power plant had the third highest profitability?


Directions for Questions: Answer the questions on the basis of the information given below.
The table given below shows the data related to a few key financial indicators for fourteen European countries in the FY 2011-12.
(2013)
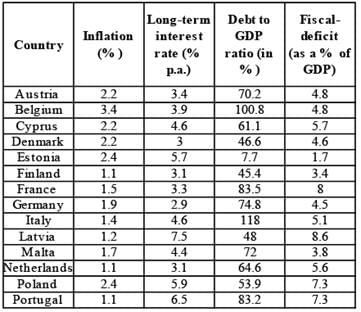
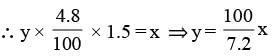
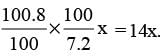
Q. If the Fiscal-deficit of France was x Euros, which was 50% more than that of Belgium, then what was the Debt (in Euros) of Belgium in FY 2011-12?
Directions for Questions: Answer the questions on the basis of the information given below.
The table given below shows the data related to a few key financial indicators for fourteen European countries in the FY 2011-12.
(2013)
Q. The countries with the Long-term interest rate less than 4% per annum, Debt to GDP ratio less than 60% and Fiscal-deficit not more than 4.6% were given a AAA rating. The number of countries rated AAA among the fourteen in FY 2011-12 was
Directions for Questions: Answer the questions on the basis of the information given below.
The table given below shows the data related to a few key financial indicators for fourteen European countries in the FY 2011-12.
(2013)
Q. If the GDP (in Euros) of Finland was 50% more than that of Italy, then by what percent was the Fiscaldeficit (in Euros) of Italy more/less than that of Finland in FY 2011-12?
Directions for Questions: Seven companies A, B, C, D, E, F and G are engaged in production of two items I and II. The comparative data about production of these items by the seven companies is given in the following Graph and Table. Study them carefully to answer the questions that follow.
(2011)
PERCENTAGE OF THE TOTAL PRODUCTION PRODUCED BY THE SEVEN COMPANIES
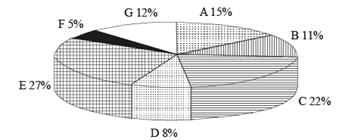
Cost of the total production (both items together) by seven companies = ₹ 25 crores
RATIO OF PRODUCTION BETWEEN ITEMS I AND II AND THE PERCENT PROFIT EARNED FOR THE TWO ITEMS
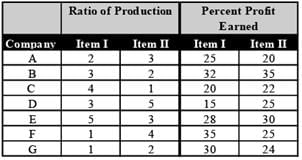
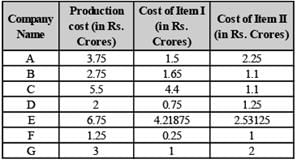
Q. Cost of production of item I by company F is what percent of the cost of production of item II by company D?
Directions for Questions: Seven companies A, B, C, D, E, F and G are engaged in production of two items I and II. The comparative data about production of these items by the seven companies is given in the following Graph and Table. Study them carefully to answer the questions that follow.
(2011)
PERCENTAGE OF THE TOTAL PRODUCTION PRODUCED BY THE SEVEN COMPANIES
Cost of the total production (both items together) by seven companies = ₹ 25 crores
RATIO OF PRODUCTION BETWEEN ITEMS I AND II AND THE PERCENT PROFIT EARNED FOR THE TWO ITEMS
Q. What is the total profit earned by company G for items I and II together?
Directions for Questions: Seven companies A, B, C, D, E, F and G are engaged in production of two items I and II. The comparative data about production of these items by the seven companies is given in the following Graph and Table. Study them carefully to answer the questions that follow.
(2011)
PERCENTAGE OF THE TOTAL PRODUCTION PRODUCED BY THE SEVEN COMPANIES
Cost of the total production (both items together) by seven companies = ₹ 25 crores
RATIO OF PRODUCTION BETWEEN ITEMS I AND II AND THE PERCENT PROFIT EARNED FOR THE TWO ITEMS
Q. What is the ratio of the cost of production of item I by company A to the cost of production of item I by company D?
Directions for Questions: Seven companies A, B, C, D, E, F and G are engaged in production of two items I and II. The comparative data about production of these items by the seven companies is given in the following Graph and Table. Study them carefully to answer the questions that follow.
(2011)
PERCENTAGE OF THE TOTAL PRODUCTION PRODUCED BY THE SEVEN COMPANIES
Cost of the total production (both items together) by seven companies = ₹ 25 crores
RATIO OF PRODUCTION BETWEEN ITEMS I AND II AND THE PERCENT PROFIT EARNED FOR THE TWO ITEMS
Q. The cost of production of both items together by company E is equal to the total cost of production of both items together by which of the two companies?
Directions for Questions: Seven companies A, B, C, D, E, F and G are engaged in production of two items I and II. The comparative data about production of these items by the seven companies is given in the following Graph and Table. Study them carefully to answer the questions that follow.
(2011)
PERCENTAGE OF THE TOTAL PRODUCTION PRODUCED BY THE SEVEN COMPANIES
Cost of the total production (both items together) by seven companies = ₹ 25 crores
RATIO OF PRODUCTION BETWEEN ITEMS I AND II AND THE PERCENT PROFIT EARNED FOR THE TWO ITEMS
Q. What is the total of the cost of production of item I by company A and the cost of production of item II by company B?
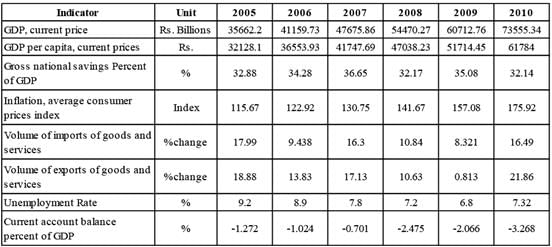
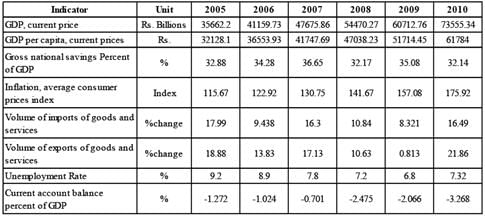
Directions for Questions: Read the table carefully and answer the questions that follow:-Given below are data points on the India economy from 2005 - 2010:
(2010)

*Per capita GDP is arrived by dividing GDP by population.
Q. What is the ratio of the current account balance in 2010 to current account balance 2005?
Directions for Questions: Read the table carefully and answer the questions that follow:-Given below are data points on the India economy from 2005 - 2010:
(2010)
*Per capita GDP is arrived by dividing GDP by population.
Q. Read the statements given below:
1. Exports were more than imports in 2006
2. Imports were more than exports in 2009
3. Export increased at faster rate than imports during period 2005 to 2010
Which of the statements is necessarily true?
Directions for Questions: Read the table carefully and answer the questions that follow:-Given below are data points on the India economy from 2005 - 2010:
(2010)
*Per capita GDP is arrived by dividing GDP by population.
Q. What was the approximate number of unemployed persons in 2006
Important Questions for Data Tabulation & Caselets - 2
Data Tabulation & Caselets - 2 MCQs with Answers
Online Tests for Data Tabulation & Caselets - 2
|
© EduRev
|
Education Revolution
|


|


within 7 days!