Grade 9 Exam > Grade 9 Tests > Test: Graphical Representation Of Data - Grade 9 MCQ
Test: Graphical Representation Of Data - Grade 9 MCQ
Test Description
5 Questions MCQ Test - Test: Graphical Representation Of Data
Test: Graphical Representation Of Data for Grade 9 2025 is part of Grade 9 preparation. The Test: Graphical Representation Of Data questions and answers have been prepared
according to the Grade 9 exam syllabus.The Test: Graphical Representation Of Data MCQs are made for Grade 9 2025 Exam.
Find important definitions, questions, notes, meanings, examples, exercises, MCQs and online tests for Test: Graphical Representation Of Data below.
Solutions of Test: Graphical Representation Of Data questions in English are available as part of our course for Grade 9 & Test: Graphical Representation Of Data solutions in
Hindi for Grade 9 course.
Download more important topics, notes, lectures and mock test series for Grade 9 Exam by signing up for free. Attempt Test: Graphical Representation Of Data | 5 questions in 5 minutes | Mock test for Grade 9 preparation | Free important questions MCQ to study for Grade 9 Exam | Download free PDF with solutions
Test: Graphical Representation Of Data - Question 1

In order to draw a frequency polygon by using a histogram, which of the following statements is incorrect?
Test: Graphical Representation Of Data - Question 2
A graphical representation of a frequency distribution in the form of rectangles with class interval as bases and heights proportional to corresponding frequencies such that there is no gap between any two successive rectangles is called a

Test: Graphical Representation Of Data - Question 3
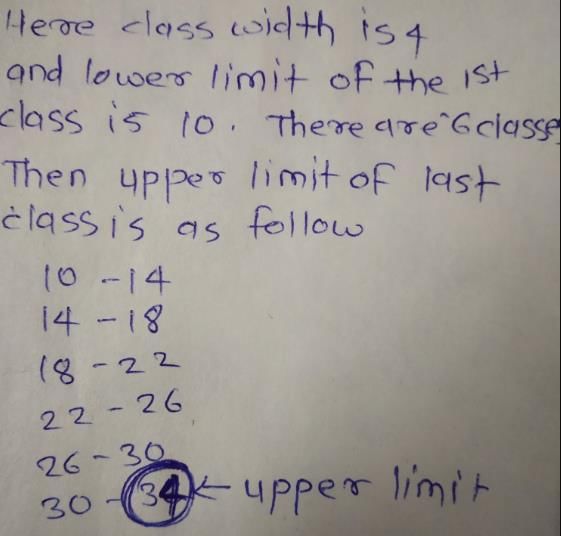
In a frequency distribution, the class-width is 4 and the lower limit of first class is 10. If there are six classes, the upper limit of last class is
Detailed Solution for Test: Graphical Representation Of Data - Question 3
Test: Graphical Representation Of Data - Question 4
A frequency polygon is drawn for the following data. So the x-coordinate of the point having y coordinate as 21 is
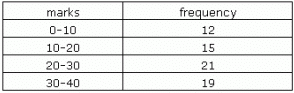
Detailed Solution for Test: Graphical Representation Of Data - Question 4
Test: Graphical Representation Of Data - Question 5
Following table gives marks and number of students of a class:
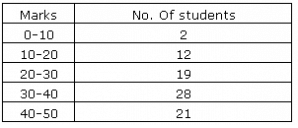
Which point on the frequency polygon will have its y coordinate as 21?
Information about Test: Graphical Representation Of Data Page
In this test you can find the Exam questions for Test: Graphical Representation Of Data solved & explained in the simplest way possible.
Besides giving Questions and answers for Test: Graphical Representation Of Data, EduRev gives you an ample number of Online tests for practice
Download as PDF
Important Questions for Graphical Representation Of Data
Find all the important questions for Graphical Representation Of Data at EduRev.Get fully prepared for Graphical Representation Of Data with EduRev's comprehensive question bank and test resources.
Our platform offers a diverse range of question papers covering various topics within the Graphical Representation Of Data syllabus.
Whether you need to review specific subjects or assess your overall readiness, EduRev has you covered.
The questions are designed to challenge you and help you gain confidence in tackling the actual exam.
Maximize your chances of success by utilizing EduRev's extensive collection of Graphical Representation Of Data resources.
Graphical Representation Of Data MCQs with Answers
Prepare for the Graphical Representation Of Data within the Grade 9 exam with comprehensive MCQs and answers at EduRev.
Our platform offers a wide range of practice papers, question papers, and mock tests to familiarize you with the exam pattern and syllabus.
Access the best books, study materials, and notes curated by toppers to enhance your preparation.
Stay updated with the exam date and receive expert preparation tips and paper analysis.
Visit EduRev's official website today and access a wealth of videos and coaching resources to excel in your exam.
Online Tests for Graphical Representation Of Data
Practice with a wide array of question papers that follow the exam pattern and syllabus.
Our platform offers a user-friendly interface, allowing you to track your progress and identify areas for improvement.
Access detailed solutions and explanations for each test to enhance your understanding of concepts.
With EduRev's Online Tests, you can build confidence, boost your performance, and ace Graphical Representation Of Data with ease.
Join thousands of successful students who have benefited from our trusted online resources.
|
© EduRev
|
Education Revolution
|


|


Signup to see your scores
go up within 7 days!
Access 1000+ FREE Docs, Videos and Tests
Takes less than 10 seconds to signup