Test: Pie Chart - 1 - Bank Exams MCQ
10 Questions MCQ Test SBI PO Prelims & Mains Preparation - Test: Pie Chart - 1
Directions for Questions: Answer the questions on the basis of the information given below.
Pie chart – 1 givens the percentage shares of all the five cement companies –A, B, C, D and E – in the total quantity of cement sold in country XYZ. Pie Chart 2 givens the percentage shares of all the eleven states – P through Z – in the total quantity of cement sold in the country.
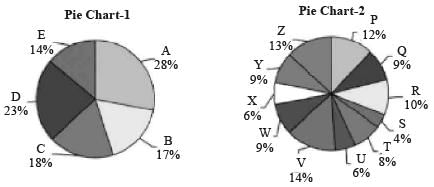
The market share of any company in a state is the total quantity of cement sold by the company in that state as a percentage of the total quantity of cement sold in that state.
(2016)
Q. In any state, if no company had more than 50% market share, then in at least how many states did company A sell cement?
Pie chart – 1 givens the percentage shares of all the five cement companies –A, B, C, D and E – in the total quantity of cement sold in country XYZ. Pie Chart 2 givens the percentage shares of all the eleven states – P through Z – in the total quantity of cement sold in the country.

The market share of any company in a state is the total quantity of cement sold by the company in that state as a percentage of the total quantity of cement sold in that state.
Directions for Questions: Answer the questions on the basis of the information given below.
Pie chart – 1 givens the percentage shares of all the five cement companies –A, B, C, D and E – in the total quantity of cement sold in country XYZ. Pie Chart 2 givens the percentage shares of all the eleven states – P through Z – in the total quantity of cement sold in the country.

The market share of any company in a state is the total quantity of cement sold by the company in that state as a percentage of the total quantity of cement sold in that state.
(2016)
Q. If in all the states in which company E was present, it had a market share of at least 25%, in at most how many states did company E sell cement?
Pie chart – 1 givens the percentage shares of all the five cement companies –A, B, C, D and E – in the total quantity of cement sold in country XYZ. Pie Chart 2 givens the percentage shares of all the eleven states – P through Z – in the total quantity of cement sold in the country.

The market share of any company in a state is the total quantity of cement sold by the company in that state as a percentage of the total quantity of cement sold in that state.
Directions for Questions: Answer the questions on the basis of the information given below.
Pie chart – 1 givens the percentage shares of all the five cement companies –A, B, C, D and E – in the total quantity of cement sold in country XYZ. Pie Chart 2 givens the percentage shares of all the eleven states – P through Z – in the total quantity of cement sold in the country.

The market share of any company in a state is the total quantity of cement sold by the company in that state as a percentage of the total quantity of cement sold in that state.
(2016)
Q. The number of companies which had sales in more than two states, is at least
Pie chart – 1 givens the percentage shares of all the five cement companies –A, B, C, D and E – in the total quantity of cement sold in country XYZ. Pie Chart 2 givens the percentage shares of all the eleven states – P through Z – in the total quantity of cement sold in the country.

The market share of any company in a state is the total quantity of cement sold by the company in that state as a percentage of the total quantity of cement sold in that state.
Directions for Questions: Answer the questions on the basis of the information given below.
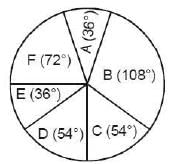
The pie chart given below shows the break-up of production cost of six products – A through F – of Zen Private Ltd. in year 2011.
The total production cost was ₹ 250 Cr.
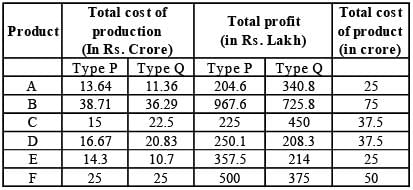
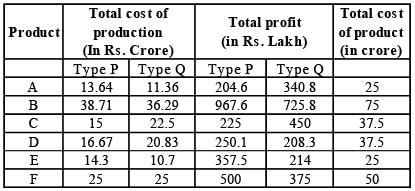
Each of the six products is produced in two varieties- Type P and Type Q. The ratio of the units produced for each product and the profit percentage on selling them is given in the table below.
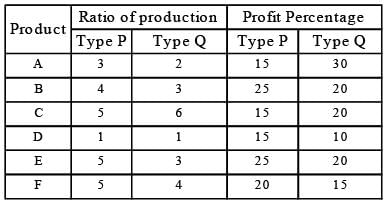
Also for each product, the cost of production per item of Type P and Type Q varieties are in the ratio 4 : 5.
(2015)
Q. For how many of the six products, is the profit made on items of type Q not more than the profit made on items of type P?
Directions for Questions: Answer the questions on the basis of the information given below.
The pie chart given below shows the break-up of production cost of six products – A through F – of Zen Private Ltd. in year 2011.
The total production cost was ₹ 250 Cr.

Each of the six products is produced in two varieties- Type P and Type Q. The ratio of the units produced for each product and the profit percentage on selling them is given in the table below.

Also for each product, the cost of production per item of Type P and Type Q varieties are in the ratio 4 : 5.
(2015)
Q. For which product is the ratio of total profit to total production cost, the lowest?
Directions for Questions: Answer the questions on the basis of the information given below.
The pie chart given below shows the break-up of production cost of six products – A through F – of Zen Private Ltd. in year 2011.
The total production cost was ₹ 250 Cr.

Each of the six products is produced in two varieties- Type P and Type Q. The ratio of the units produced for each product and the profit percentage on selling them is given in the table below.

Also for each product, the cost of production per item of Type P and Type Q varieties are in the ratio 4 : 5.
(2015)
Q. For how many products, overall profit percentage is more than 20%?
Directions for Questions: Answer the questions on the basis of the information given below.
The pie chart given below shows the break-up of production cost of six products – A through F – of Zen Private Ltd. in year 2011.
The total production cost was ₹ 250 Cr.

Each of the six products is produced in two varieties- Type P and Type Q. The ratio of the units produced for each product and the profit percentage on selling them is given in the table below.

Also for each product, the cost of production per item of Type P and Type Q varieties are in the ratio 4 : 5.
(2015)
Q. The nearest integer to the total cost (In ₹Cr.) incurred in producing type A of products A, D & F is
Directions for Questions: Answer the questions on the basis of the information given below.
The following pie chart gives details of the production, expenses and export of the six products manufactured by company KL Enterprises, which manufactures only the given six products, in the year 2014. In the given year, the company followed a very strict internal audit policy and any item that did not meet the specifications were rejected and disposed off. All the products exported were those manufactured in the same year itself.
(2015)

Profit = Sales – Expenses
Profitability(%) = Profit / Expenses x 100
Q. In 2014, the products exported as a percentage of the products manufactured by the company could not be more than
Directions for Questions: Answer the questions on the basis of the information given below.
The following pie chart gives details of the production, expenses and export of the six products manufactured by company KL Enterprises, which manufactures only the given six products, in the year 2014. In the given year, the company followed a very strict internal audit policy and any item that did not meet the specifications were rejected and disposed off. All the products exported were those manufactured in the same year itself.
(2015)

Profit = Sales – Expenses
Profitability(%) = Profit / Expenses x 100
Q. In 2014, if product D was a profit making product for the company, what was the maximum number of products that were loss making products for the company?
Directions for Questions: Answer the questions on the basis of the information given below.
The following pie chart gives details of the production, expenses and export of the six products manufactured by company KL Enterprises, which manufactures only the given six products, in the year 2014. In the given year, the company followed a very strict internal audit policy and any item that did not meet the specifications were rejected and disposed off. All the products exported were those manufactured in the same year itself.
(2015)

Profit = Sales – Expenses
Profitability(%) = Profit / Expenses x 100
Q. The export price per unit of which product was the highest?
|
628 videos|824 docs|280 tests
|


