Test: Quantitative Techniques- 5 - CLAT MCQ
15 Questions MCQ Test CLAT Mock Test Series 2025 - Test: Quantitative Techniques- 5

Directions: Study the following graph carefully to answer the questions –
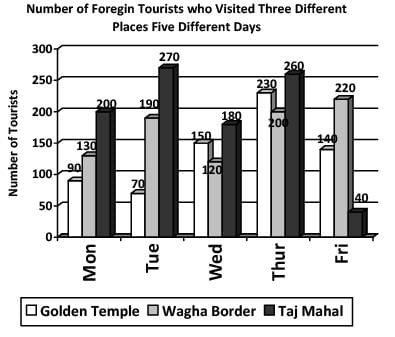
Q. What is the average number of foreign tourists who visited Wagha Border on all the days together?
Directions: Study the following graph carefully to answer the questions –

Q. On which day was the difference between the number of foreign tourists who visited Taj Mahal and Golden Temple, second highest?
| 1 Crore+ students have signed up on EduRev. Have you? Download the App |
Directions: Study the following graph carefully to answer the questions –
Q. What is the respective ratio between the number of foreign tourists who visited Taj Mahal on Thursday and the number of foreign tourists who visited Golden Temple on Friday?
Directions: Study the following graph carefully to answer the questions –
Q. On which day was the total number of foreign tourists who visited all the three places together second lowest?
Directions: Study the following graph carefully to answer the questions –
Q. Total number of foreign tourists who visited all the three places on Tuesday together is what per cent of the total number of foreign tourists who visited Wagha Border on Monday and Wednesday together?
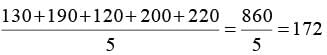
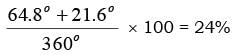
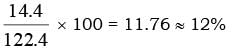
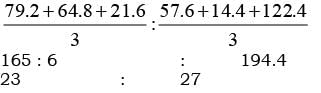
Directions: Study the following piechart carefully and answer the questions given below:
Preferences of students for six chocolates in terms of degrees of angle in the pie-chart
Total number of students = 6800
Q. What is the difference between the total number of students who prefer Dairy Milk and Perk together and the total number of students who prefer Munch and Temptation together?
Directions: Study the following piechart carefully and answer the questions given below:
Preferences of students for six chocolates in terms of degrees of angle in the pie-chart

Total number of students = 6800
Q. What is the ratio of the number of students who prefer Temptation to the number of students who prefer Dairy Milk?
Directions: Study the following piechart carefully and answer the questions given below:
Preferences of students for six chocolates in terms of degrees of angle in the pie-chart
Total number of students = 6800
Q. The number of students who prefer KitKat and Temptation together is what per cent of the total number of students?
Directions: Study the following piechart carefully and answer the questions given below:
Preferences of students for six chocolates in terms of degrees of angle in the pie-chart
Total number of students = 6800
Q. The number of students who prefer Perk is approximately what per cent of the number of students who prefer Munch?
Directions: Study the following piechart carefully and answer the questions given below:
Preferences of students for six chocolates in terms of degrees of angle in the pie-chart
Total number of students = 6800
Q. What is the ratio of the average of the students who prefer Dairy Milk, KitKat and Temptation together to those who prefer BarOne, Perk and Munch together?
Directions: Study the following table carefully. Some values are missing. Complete that based on given information in each question to answer the question.
The table shows the number of employees in an organization in 5 different cities with total employees being 2130 in the organization. Table also shows the percentage of employees working in 4 departments – HR, Finance, Software and Accounts with each employee in only 1 department.

Q. What is the total number of employees in Mumbai and Gurgaon who work in Software department?
Directions: Study the following table carefully. Some values are missing. Complete that based on given information in each question to answer the question.
The table shows the number of employees in an organization in 5 different cities with total employees being 2130 in the organization. Table also shows the percentage of employees working in 4 departments – HR, Finance, Software and Accounts with each employee in only 1 department.

Q. If in Delhi, employees who work in Accounts department are 40% more than employees who work in HR department, then what is the number of employees who work in Software department in Delhi?
Directions: Study the following table carefully. Some values are missing. Complete that based on given information in each question to answer the question.
The table shows the number of employees in an organization in 5 different cities with total employees being 2130 in the organization. Table also shows the percentage of employees working in 4 departments – HR, Finance, Software and Accounts with each employee in only 1 department.
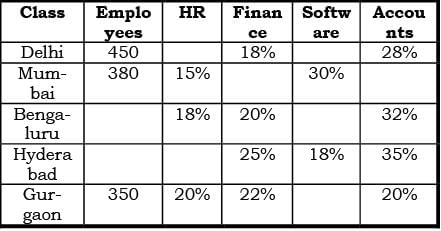
Q. If number of employees in Bengaluru is 10% less than number of employees in Hyderabad, then what is the difference between number of employees who work in Accounts department in these 2 cities and who work in Finance department in these 2 cities?
Directions: Study the following table carefully. Some values are missing. Complete that based on given information in each question to answer the question.
The table shows the number of employees in an organization in 5 different cities with total employees being 2130 in the organization. Table also shows the percentage of employees working in 4 departments – HR, Finance, Software and Accounts with each employee in only 1 department.
Q. If a same criterion as taken in question 33 is taken, in which city the total employees who work in Finance and Accounts departments is more?
Directions: Study the following table carefully. Some values are missing. Complete that based on given information in each question to answer the question.
The table shows the number of employees in an organization in 5 different cities with total employees being 2130 in the organization. Table also shows the percentage of employees working in 4 departments – HR, Finance, Software and Accounts with each employee in only 1 department.
Q. If in Mumbai, number of employees who work in Accounts department is 19 more than the number of employees who work in Software department in Gurgaon, then what is the number of employees who work in Finance department in Mumbai?
|
1 videos|10 docs|63 tests
|
|
1 videos|10 docs|63 tests
|
Top Courses for CLAT


Important Questions for Quantitative Techniques- 5
Quantitative Techniques- 5 MCQs with Answers
Online Tests for Quantitative Techniques- 5 CLAT Mock Test Series 2025
|
© EduRev
|
Education Revolution
|


|


