Test: Quantitative Techniques- 6 - CLAT MCQ
19 Questions MCQ Test - Test: Quantitative Techniques- 6

Directions : Answer the questions on the basis of the information given below.
The table given below shows the minimum and the maximum temperature (in degree Celsius) recorded on the 1 st day of each month in five different cities.
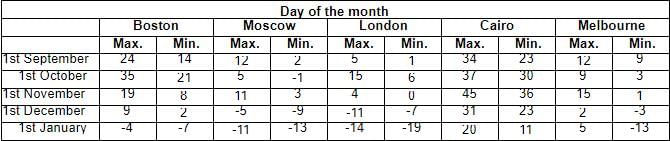
What is the difference between the maximum temperature of London on 1st November and the minimum temperature of Boston on 1 st January?
The table given below shows the minimum and the maximum temperature (in degree Celsius) recorded on the 1 st day of each month in five different cities.
Directions : Answer the questions on the basis of the information given below.
The table given below shows the minimum and the maximum temperature (in degree Celsius) recorded on the 1 st day of each month in five different cities.

During the given five months which city recorded the maximum variation in temperature and by how much? (Variation = Highest max. temp - Lowest min. temp)
The table given below shows the minimum and the maximum temperature (in degree Celsius) recorded on the 1 st day of each month in five different cities.
| 1 Crore+ students have signed up on EduRev. Have you? Download the App |
Directions : Answer the questions on the basis of the information given below.
The table given below shows the minimum and the maximum temperature (in degree Celsius) recorded on the 1 st day of each month in five different cities.

In which month is the difference between the maximum and the minimum temperatures of Boston the second highest?
The table given below shows the minimum and the maximum temperature (in degree Celsius) recorded on the 1 st day of each month in five different cities.
Directions : Answer the questions on the basis of the information given below.
The table given below shows the minimum and the maximum temperature (in degree Celsius) recorded on the 1 st day of each month in five different cities.

What is the average maximum temperature of Melbourne over all the months together?
Directions : Answer the questions on the basis of the information given below.
The table given below shows the minimum and the maximum temperature (in degree Celsius) recorded on the 1 st day of each month in five different cities.

What is the ratio of the minimum temperature of Melbourne on 1st September to the maximum temperature of London on 1st October?
Contribution Margin and Market Share of Company A is given for 8 months period. First being April to last being November (simultaneous months from April to November). If the contribution margin of the March is Rs. 1 lakh, then answer the questions based on the data given.
How much has market share changed from 4th month to 8th month assuming the customer base is same for all the months?
Directions : Answer the questions on the basis of the information given below.
Mr.Jindal purchases shares of six companies - A, B, C, D, E and F - in January 2018 and reviews his investment portfolio after a year. The six companies fall under three broad categories - IT, Pharmaceutical and FMCG.
The line graph given below shows the share prices of the 6 companies in January 2018 and 2019.
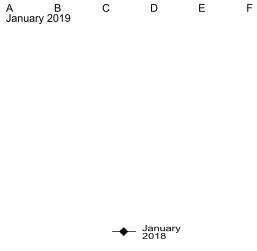
If one of the two FMCG companies showed the highest percentage variation in the share price while the other FMCG company showed the lowest percentage variation and Mr.Jindal had purchased 150 shares of each of these companies, then what was the total value of these shares in January 2019?
Directions : Answer the questions on the basis of the information given below.
Mr.Jindal purchases shares of six companies - A, B, C, D, E and F - in January 2018 and reviews his investment portfolio after a year. The six companies fall under three broad categories - IT, Pharmaceutical and FMCG.
The line graph given below shows the share prices of the 6 companies in January 2018 and 2019.

If Mr.Jindal had purchased 10 shares each of four of the above mentioned companies, then what can be the minimum possible percentage return?
Directions : Answer the questions on the basis of the information given below.
Mr.Jindal purchases shares of six companies - A, B, C, D, E and F - in January 2018 and reviews his investment portfolio after a year. The six companies fall under three broad categories - IT, Pharmaceutical and FMCG.
The line graph given below shows the share prices of the 6 companies in January 2018 and 2019.

Which of the following represents the descending order of the percentage increase in share prices of the above mentioned companies?
Directions : Answer the questions on the basis of the information given below.
Mr.Jindal purchases shares of six companies - A, B, C, D, E and F - in January 2018 and reviews his investment portfolio after a year. The six companies fall under three broad categories - IT, Pharmaceutical and FMCG.
The line graph given below shows the share prices of the 6 companies in January 2018 and 2019.

If Mr.Jindal had purchased exactly 100 shares on
January 2018, then what would be the difference between the maximum and minimum returns that he could possibly get in January 2019 from buying the shares of these six companies in any combination?
Directions : Answer the questions on the basis of the information given below. The table given below shows the State-wise Population Growth Rate of 10 states, in percentages.

Select the options that represents the states which occupied the first two ranks in terms of the population growth rate during the given three decades.
Directions : Answer the questions on the basis of the information given below. The table given below shows the State-wise Population Growth Rate of 10 states, in percentages.
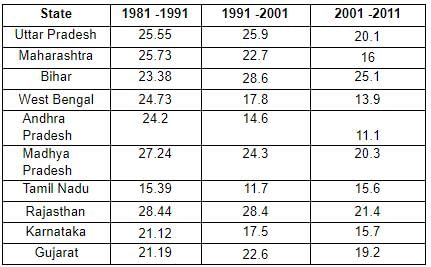
Select the option with the states for which the rank in terms of the population growth rate remained unchanged from 1991-2001 to 2001-2011.
Directions : Answer the questions on the basis of the information given below. The table given below shows the State-wise Population Growth Rate of 10 states, in percentages.

Which among the following four states shows the highest percentage increase in population from 1981-1991 to 2001-2011?
Directions : Answer the questions on the basis of the information given below. The table given below shows the State-wise Population Growth Rate of 10 states, in percentages.

In how many states did the population growth rate increase from 1981-1991 to 1991-2001?
Directions : Answer the questions on the basis of the information given below.
The line graph given below shows the Consumer Price Index of five States/UTs from January to October of the year 2016.

Which was the only state to register a drop in the Consumer Price Index from January to October and by how many points did it drop?
Directions : Answer the questions on the basis of the information given below.
The line graph given below shows the Consumer Price Index of five States/UTs from January to October of the year 2016.

Which state did not register a continuous increase or decrease in the Consumer Price Index for more than one time interval during the above mentioned time period?
Directions : Answer the questions on the basis of the information given below.
The line graph given below shows the Consumer Price Index of five States/UTs from January to October of the year 2016.
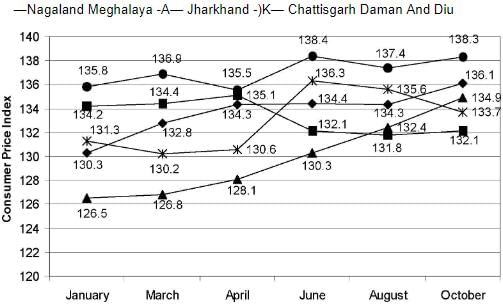
What was the change in the average Consumer Price Index of all the five States/UTs from April to October?
Directions : Answer the questions on the basis of the information given below.
The line graph given below shows the Consumer Price Index of five States/UTs from January to October of the year 2016.

If he States/UTs are ranked according to the 531 increase in the number of points in the Consumer Price Index from January to October of 2016, then which three States/UTs are first, second and third?
Directions : Answer the questions on the basis of the information given below.
The line graph given below shows the Consumer Price Index of five States/UTs from January to October of the year 2016.

During the above mentioned time period which States/UTs registered the highest and the lowest Consumer Price Indices and during which months respectively?
Top Courses for CLAT


Important Questions for Quantitative Techniques- 6
Quantitative Techniques- 6 MCQs with Answers
Online Tests for Quantitative Techniques- 6
|
© EduRev
|
Education Revolution
|


|


