Chemistry Exam  >  Chemistry Tests  >  Organic Chemistry  >  Test: Spectroscopy Level - 1 - Chemistry MCQ

Test: Spectroscopy Level - 1 - Chemistry MCQ


Test Description

30 Questions MCQ Test Organic Chemistry - Test: Spectroscopy Level - 1

Test: Spectroscopy Level - 1 for Chemistry 2025 is part of Organic Chemistry preparation. The Test: Spectroscopy Level - 1 questions and answers have been prepared according to the Chemistry exam syllabus.The Test: Spectroscopy Level - 1 MCQs are made for Chemistry 2025 Exam. Find important definitions, questions, notes, meanings, examples, exercises, MCQs and online tests for Test: Spectroscopy Level - 1 below.
Solutions of Test: Spectroscopy Level - 1 questions in English are available as part of our Organic Chemistry for Chemistry & Test: Spectroscopy Level - 1 solutions in Hindi for Organic Chemistry course. Download more important topics, notes, lectures and mock test series for Chemistry Exam by signing up for free. Attempt Test: Spectroscopy Level - 1 | 35 questions in 70 minutes | Mock test for Chemistry preparation | Free important questions MCQ to study Organic Chemistry for Chemistry Exam | Download free PDF with solutions
Test: Spectroscopy Level - 1 - Question 1

A molecule, AX, has a vibrational energy of 1000 cm–1 and rotational energy of 10 cm–1. Another molecule, BX, has a vibrational energy of 400 cm–1 and rotational energy of 40 cm–1. Which one of the following statements about the coupling of vibrational and rotational motion is true:

Detailed Solution for Test: Spectroscopy Level - 1 - Question 1

More the rotational energy, more will be the coupling.

Therefore, The coupling is stronger in BX.

Test: Spectroscopy Level - 1 - Question 2

The order of carbonyl stretching frequency in the IR spectra of ketone, amide and anhydride is:

Detailed Solution for Test: Spectroscopy Level - 1 - Question 2

The order of carbonyl stretching frequencies in IR spectra can be understood by examining the different functional groups involved.

  • Anhydrides generally exhibit the highest stretching frequency due to their strong resonance and electron-withdrawing properties.
  • Amides have a moderate stretching frequency. The nitrogen atom contributes to resonance, lowering the frequency compared to anhydrides.
  • Ketones have the lowest stretching frequency among these groups, as they lack the additional resonance effects provided by nitrogen or oxygen in other structures.

The typical order of carbonyl stretching frequencies is:

  • Anhydride > Amide > Ketone
Test: Spectroscopy Level - 1 - Question 3

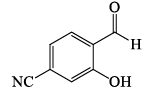
In the IR spectrum, carbonyl absorption band for the following compound appears at:

Test: Spectroscopy Level - 1 - Question 4

In the IR spectrum of p-nitrophenyl acetate, the carbonyl absorption band appears at:

Detailed Solution for Test: Spectroscopy Level - 1 - Question 4

In the IR spectrum of p-nitrophenyl acetate, the carbonyl absorption band appears at:

  • The carbonyl group typically absorbs in the range of 1700 cm–1 to 1750 cm–1.
  • For p-nitrophenyl acetate, the specific absorption is observed at 1760 cm–1.
  • This absorption is due to the strong carbonyl (C=O) bond in the ester functional group.
  • Factors influencing the exact frequency include the surrounding groups and molecular structure.
Test: Spectroscopy Level - 1 - Question 5

A triatomic molecule of the type AB2 shows two IR absorption lines and one IR-Raman line. The structure of the molecule is:

Detailed Solution for Test: Spectroscopy Level - 1 - Question 5

B cannot be as its both IR - Raman active, and according to the rule of mutual exclusion, a molecule having centre of symmetry only one of them can be active.

Test: Spectroscopy Level - 1 - Question 6

In the IR spectrum, the absorption band due to carbonyl group in phenyl acetate appears at:

Detailed Solution for Test: Spectroscopy Level - 1 - Question 6

The carbonyl group in phenyl acetate typically absorbs infrared (IR) radiation at a specific frequency. This absorption is indicative of the chemical structure and environment of the molecule.

  • The absorption band appears due to the stretching vibrations of the carbonyl (C=O) bond.
  • In phenyl acetate, this band is found around 1760 cm–1.
  • This frequency can vary slightly based on factors such as molecular interactions and the surrounding environment.

Understanding the position of this absorption band is crucial for identifying and analysing the presence of carbonyl compounds in various samples.

Test: Spectroscopy Level - 1 - Question 7

In the IR spectrum of p-nitrophenyl, acetate, the carbonyl absorption band appears at:

Detailed Solution for Test: Spectroscopy Level - 1 - Question 7

The carbonyl absorption band in p-nitrophenyl acetate can be characterised by its position in the infrared (IR) spectrum. Typically, carbonyl groups (C=O) have distinct absorption frequencies that can provide insights into their chemical environment.

  • The absorption band for carbonyl groups is generally found in the range of 1700 cm–1 to 1750 cm–1.
  • For p-nitrophenyl acetate, the specific carbonyl absorption is closer to 1770 cm–1.
  • This frequency indicates the presence of an ester functional group, which typically exhibits a higher frequency due to the influence of adjacent electron-withdrawing groups.

In summary, the IR spectrum of p-nitrophenyl acetate shows the carbonyl absorption band at 1770 cm–1, confirming its structure and functional groups.

Test: Spectroscopy Level - 1 - Question 8

A compound with molecule formula C4H6O2 shows band at 1170 cm–1 in IR spectrum and peaks at 178, 68, 28 and 22 ppm in 13C NMR spectrum. The correct structure of the compound is:

Detailed Solution for Test: Spectroscopy Level - 1 - Question 8

The compound with the molecular formula C4H6O2 exhibits specific characteristics that help identify its structure:

  • The infrared (IR) spectrum shows a band at 1170 cm–1, indicating the presence of certain functional groups.
  • In the 13C NMR spectrum, there are peaks at the following chemical shifts:
    • 178 ppm
    • 68 ppm
    • 28 ppm
    • 22 ppm

These spectral features suggest that the compound is likely a simple carboxylic acid or ester. The high-field shifts in the NMR spectrum correspond to carbon atoms in carbonyl and alkyl groups.

Upon analysing the provided structures:

  • Structure A: Shows a different arrangement of carbonyl and alkyl groups.
  • Structure B: Contains functional groups inconsistent with the IR data.
  • Structure C: Aligns with the spectral data, suggesting it has both carbonyl and alkyl functionalities.
  • Structure D: Displays a structure that does not match the expected chemical shifts.

Thus, the correct structure of the compound is C.

Test: Spectroscopy Level - 1 - Question 9

The compound that exhibits sharp bands at 3300 and 2150 cm–1 in the IR spectrum is:

Detailed Solution for Test: Spectroscopy Level - 1 - Question 9

The compound that shows distinct absorption bands at 3300 and 2150 cm–1 in the IR spectrum typically indicates the presence of specific functional groups.

  • The band at 3300 cm–1 suggests the presence of an alkyne or an amine.
  • The band at 2150 cm–1 is characteristic of an alkyne C≡C bond or a nitrile C≡N bond.

Given these observations, we can analyse the compounds listed:

  • 1-butyne: This compound contains a terminal alkyne, which explains both the sharp bands.
  • 2-butyne: A symmetrical alkyne, it does not exhibit a terminal hydrogen and may not show the same IR absorption.
  • Butyronitrile: This compound has a nitrile group, which would show a band at 2150 cm–1, but lacks the terminal alkyne absorption.
  • Butylamine: This compound features an amine group, which would show a band at 3300 cm–1, but not the 2150 cm–1 band.

Thus, the presence of both bands strongly suggests that the correct compound is 1-butyne.

Test: Spectroscopy Level - 1 - Question 10

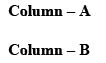
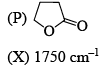
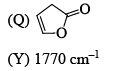
Correctly matched structure and carbonyl stretching frequency set is:

Test: Spectroscopy Level - 1 - Question 11

Among the following, the compound that displays an IR band at 2150 cm–1 is:

Detailed Solution for Test: Spectroscopy Level - 1 - Question 11

The compound that exhibits an IR band at 2150 cm–1 is identified as follows:

  • Compound C is the correct answer.
  • IR bands in the range of 2100-2300 cm–1 typically indicate the presence of alkyne functional groups or certain types of nitriles.
  • When analysing compounds, Infrared Spectroscopy is crucial for identifying functional groups based on their characteristic absorption bands.
  • In this case, the specific band at 2150 cm–1 suggests the presence of a carbon-carbon triple bond.
Test: Spectroscopy Level - 1 - Question 12

The compound which shows IR frequencies at both 3314 and 2126 cm–1 is:

Detailed Solution for Test: Spectroscopy Level - 1 - Question 12

The compound that exhibits IR frequencies at both 3314 and 2126 cm–1 is:

  • 3314 cm–1: This frequency typically indicates the presence of an –OH (alcohol or thiol) or –NH (amine) group.
  • 2126 cm–1: This frequency is characteristic of a triple bond (C≡C or C≡N), suggesting the presence of alkynes or nitriles.

To identify the compound from the options provided, we need to look for:

  • A compound containing an –OH or –NH functional group.
  • A compound that also includes a triple bond (C≡C or C≡N).

Among the options:

  • Option A: CH3(CH2)4CH2SH - Contains a thiol group, likely showing the 3314 cm–1 frequency.
  • Option B: CH3(CH2)4CH2C≡N - Contains a nitrile group, likely showing the 2126 cm–1 frequency.
  • Option C: CH3(CH2)4CH2C≡C–H - Contains both a terminal alkyne and a potential thiol, matching both IR frequencies.
  • Option D: CH3(CH2)2C≡C(CH2)2CH3 - Contains a triple bond but does not clearly indicate an –OH or –NH group.

Based on this analysis, the most suitable option is:

  • Option C as it aligns with the observed IR frequencies.
Test: Spectroscopy Level - 1 - Question 13

For the molecule CBr4, the number of peaks which comprise the cluster for the molecular ion will be which of the following?

Detailed Solution for Test: Spectroscopy Level - 1 - Question 13

Since bromine has two separate isotopes (79 and 81, with approximately the same proportions of each), the possibilities for different molecular masses will be those with four 79 isotopes, three 79 and one 81 isotope, two of each isotope, three 81s and one 79 isotopes, and four 81 isotopes - i.e. 5 in total.

Test: Spectroscopy Level - 1 - Question 14

The IR stretching frequencies (cm–1) for the compound X are as follows: 3300-3500 (s, br); 3000 (m); 2225 (s); 1680(s). The correct assignment of the absorption bands is:

Test: Spectroscopy Level - 1 - Question 15

Among the compounds given in the option (a) to (d), the one that exhibits a sharp band at around 3300 cm–1 in the IR spectrum is:

Detailed Solution for Test: Spectroscopy Level - 1 - Question 15

-In the IR spectrum exhibits a sharp band at around 3300 cm–1 is 1-butyne.

-1-Butyne, also known as ethylacetylene, but-1-yne, ethylethyne, and UN 2452, is an extremely flammable and reactive alkyne with chemical formula C4H6 and CAS number 107-00-6 that is used in the synthesis of organic compounds. It occurs as a colorless gas.

Test: Spectroscopy Level - 1 - Question 16

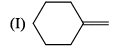
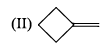
The correct order of IR stretching frequency of the C=C in the following olefins is:

Test: Spectroscopy Level - 1 - Question 17

Arrange the chacacteristic timescales of the following set of dynamical spectroscopic techniques in decreasing order of time (longest to shortest); NMR (Nuclear Magnetic Resonance), ESR (Electron Spin Resonance), Fluorescence, Raman and Absorption.

Detailed Solution for Test: Spectroscopy Level - 1 - Question 17

The characteristic timescales of various dynamical spectroscopic techniques can be arranged in decreasing order of time (from longest to shortest) as follows:

  • Absorption
  • NMR (Nuclear Magnetic Resonance)
  • Fluorescence
  • ESR (Electron Spin Resonance)
  • Raman

In summary:

  • Absorption has the longest timescale.
  • NMR follows, providing detailed insights into molecular structures.
  • Fluorescence is quicker and useful in studying excited states.
  • ESR is faster, focusing on unpaired electrons.
  • Raman techniques are the quickest among these methods.
Test: Spectroscopy Level - 1 - Question 18

What are the limits of detection of the following common analytical methods used with capillary separations: fluorescence, mass spectrometry, UV-Vis absorbance, and NMR, respectively, in mol:

Detailed Solution for Test: Spectroscopy Level - 1 - Question 18

Fluorescence, mass spectrometry, UV-Vis absorbance, and NMR are commonly used analytical methods in capillary separations, each with varying limits of detection (LOD). Here’s a brief overview of their detection limits expressed in moles:

  • Fluorescence:

    Detection limits range from 10–18 to 10–23 moles.

  • Mass Spectrometry:

    Detection limits span 10–13 to 10–21 moles.

  • UV-Vis Absorbance:

    Detection limits are between 10–13 and 10–16 moles.

  • Nuclear Magnetic Resonance (NMR):

    Detection limits fall within 10–9 to 10–11 moles.

These limits reflect the sensitivity of each method when identifying different substances in complex mixtures.

Test: Spectroscopy Level - 1 - Question 19

Of the molecules CH4, CO2, benzene and H2, the ones that will absorb infrared radiation are:

Detailed Solution for Test: Spectroscopy Level - 1 - Question 19

Infrared radiation absorption occurs when certain molecules can take up energy from infrared light. Among the provided molecules, the ability to absorb this radiation varies based on their structure.

  • CH4 (methane):

    This molecule can absorb infrared radiation due to its vibrational modes. These vibrations allow it to interact with infrared light effectively.

  • CO2 (carbon dioxide):

    Carbon dioxide is well-known for its ability to trap heat in the atmosphere, primarily because it can absorb infrared radiation through its bending and stretching vibrations.

  • Benzene:

    Benzene can also absorb infrared radiation, mainly due to its aromatic structure which enables various vibrational transitions.

  • H2 (hydrogen):

    This molecule does not absorb infrared radiation because it lacks a permanent dipole moment and does not have the necessary vibrational transitions.

In summary, the molecules that can absorb infrared radiation are CH4, CO2, and benzene. In contrast, H2 does not have this ability.

Test: Spectroscopy Level - 1 - Question 20

IR stretching frequencies of carbonyl groups in aldehydes and acid chlorides in cm–1 are:

Detailed Solution for Test: Spectroscopy Level - 1 - Question 20

IR stretching frequencies for carbonyl groups in aldehydes and acid chlorides are typically measured in cm–1. Here are the common ranges:

  • Aldehydes:
    • 1730 – 1700 cm–1
    • 1650 – 1580 cm–1
  • Acid Chlorides:
    • 1730 – 1700 cm–1
    • 1820 – 1770 cm–1

The stretching frequencies can vary based on the molecular environment and substituents attached to the carbonyl group. Understanding these frequencies is crucial for identifying functional groups in organic compounds.

Test: Spectroscopy Level - 1 - Question 21

The bond that gives the most intense band in the infrared spectrum for its stretching vibrations is:

Detailed Solution for Test: Spectroscopy Level - 1 - Question 21

Approximate Infrared Stretching Frequencies: 

  • C–H - 3000 cm-1
  • N–H - 3600 cm-1
  • O–H - 3600 cm-1
  • S–H - 2570 cm-1
Test: Spectroscopy Level - 1 - Question 22

An examinations of saturated hydrocarbons containing methyl group show asymmetrical (Vas) and symmetrical (Vs) stretching modes in the region of:

Detailed Solution for Test: Spectroscopy Level - 1 - Question 22

Saturated hydrocarbons containing a methyl group exhibit two types of stretching modes:

  • The asymmetrical (Vas) stretching mode occurs in the region of 2960 cm–1.
  • The symmetrical (Vs) stretching mode is found around 2870 cm–1.

These modes are essential for understanding the behaviour of hydrocarbons in various applications, such as:

  • Infrared spectroscopy, which helps identify organic compounds.
  • Studying the vibrational properties of molecules.
  • Determining molecular structures and interactions.

In summary, the stretching modes at 2960 cm–1 and 2870 cm–1 are key indicators in the analysis of saturated hydrocarbons with methyl groups.

Test: Spectroscopy Level - 1 - Question 23

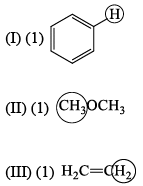
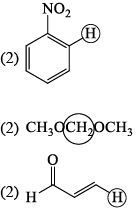
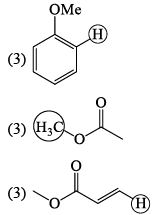
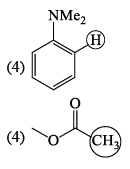
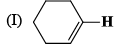
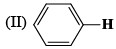
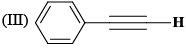
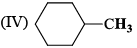
For each set of compounds below, choose the one in which the indicated hydrogen is farthest upfield in a proton NMR spectrum:

Detailed Solution for Test: Spectroscopy Level - 1 - Question 23

In NMR spectroscopy upfield means the shielded protons. Hence the farthest upfield are the ones that are most effectively shielded from NMR spectroscopy rays.

According to the above discussion A is correct.

Test: Spectroscopy Level - 1 - Question 24

The molecule with the smallest rotational constant (in the microwave spectrum) among the following is:

Detailed Solution for Test: Spectroscopy Level - 1 - Question 24

The rotational constant of a molecule is influenced by its structure and mass distribution. In microwave spectroscopy, the molecule with the smallest rotational constant typically has a greater moment of inertia.

  • The moment of inertia depends on both the mass of the atoms and their arrangement in the molecule.
  • Molecules with larger distances between their atoms tend to have higher moments of inertia, resulting in lower rotational constants.
  • Considering the given options, we can analyse each molecule:
    • N≡CH: A linear molecule with a small moment of inertia.
    • HC≡CCl: A more complex structure that increases the moment of inertia.
    • CCl≡CF: Similar to the previous one, this also has a larger moment of inertia.
    • B≡CCl: This molecule's structure further contributes to a higher moment of inertia.
  • After comparing these structures, it is evident that the one with the smallest rotational constant is CCl≡CF.
Test: Spectroscopy Level - 1 - Question 25

N2 does not show pure vibrational spectral because:

Detailed Solution for Test: Spectroscopy Level - 1 - Question 25
  • A homonuclear diatomic molecule like H2, O2, N2, etc. which have only stretching motion/vibrations and no bending motion/vibrations, the dipole moment does not change during vibration.
  • Hence these molecules do not give vibration spectra i.e. they are said to be infrared-inactive.
Test: Spectroscopy Level - 1 - Question 26

Which of the following molecules has the lowest vibrational stretching frequency:

Detailed Solution for Test: Spectroscopy Level - 1 - Question 26

C is correct because more the reduced mass, less the vibrational stretching frequency.

Test: Spectroscopy Level - 1 - Question 27

A radiation that has an energy of N 50 kJ mol–1 falls in the following region of the electromagnetic spectrum:

Detailed Solution for Test: Spectroscopy Level - 1 - Question 27
  • The electromagnetic spectrum illustrates all the possible electromagnetic radiations, their categorization on the basis of energies, frequencies, wavelengths.
  • In the electromagnetic spectrum, energy is expressed in electron volt.
    ∴ First, we convert kJ to eV
    i.e. 1 Joule = 6.242 × 10¹⁸ eV
    1eV = (1.60217733 × 10^-22) × (6.0223 × 10^23) = 96.49 kJ/mole
    ⇒ 50 kJ/mole = 0.485 eV
  • This eV falls in the infrared radiation.
Test: Spectroscopy Level - 1 - Question 28

The rotational constant (B) of H35Cl, H37Cl and D35Cl follow the order:

Detailed Solution for Test: Spectroscopy Level - 1 - Question 28

The value of B decreases with isotopic substitution.

Test: Spectroscopy Level - 1 - Question 29

The spectroscopic data for an organic compound with molecular formula C10H12O2 are given below. IR band around 1750 cm–1. 1H NMR d 7.3 (m, 5H), 5.85 (q, 1H, J = 7.2 Hz), 2.05 (s, 3H), 1.5 (d, 3H, J = 7.2 Hz) ppm. The compound is:

Detailed Solution for Test: Spectroscopy Level - 1 - Question 29

The spectroscopic data for the organic compound with the molecular formula C10H12O2 reveals several key features:

  • The IR band at approximately 1750 cm−1 suggests the presence of a carbonyl group (C=O), commonly found in esters.
  • The 1H NMR data shows:
    • A multiplet at 7.3 ppm, indicating the presence of five hydrogen atoms on an aromatic ring.
    • A quartet at 5.85 ppm (1H, J = 7.2 Hz), likely corresponding to a methylene group (–CH2–) adjacent to a carbonyl.
    • A singlet at 2.05 ppm (3H), which typically represents a methyl group attached to a carbonyl.
    • A doublet at 1.5 ppm (3H, J = 7.2 Hz), suggesting another methyl group likely attached to a carbon adjacent to a methylene group.

Based on these observations, the compound is likely an ester, as indicated by the carbonyl and the hydrogen signals.

The combination of the spectral data suggests the structure aligns best with the compound:

  • 1-(phenylethy) acetate
Test: Spectroscopy Level - 1 - Question 30

The correct order of the 1H NMR chemical shift values (β) for the indicated hydrogens (in bold) in the following compounds is:

View more questions
35 videos|92 docs|46 tests
Information about Test: Spectroscopy Level - 1 Page
In this test you can find the Exam questions for Test: Spectroscopy Level - 1 solved & explained in the simplest way possible. Besides giving Questions and answers for Test: Spectroscopy Level - 1, EduRev gives you an ample number of Online tests for practice
35 videos|92 docs|46 tests
Download as PDF