Bank Exams Exam  >  Bank Exams Tests  >  IBPS Clerk Prelims 2024 Preparation  >  Test: Tabulation - Bank Exams MCQ

Test: Tabulation - Bank Exams MCQ


Test Description

18 Questions MCQ Test IBPS Clerk Prelims 2024 Preparation - Test: Tabulation

Test: Tabulation for Bank Exams 2024 is part of IBPS Clerk Prelims 2024 Preparation preparation. The Test: Tabulation questions and answers have been prepared according to the Bank Exams exam syllabus.The Test: Tabulation MCQs are made for Bank Exams 2024 Exam. Find important definitions, questions, notes, meanings, examples, exercises, MCQs and online tests for Test: Tabulation below.
Solutions of Test: Tabulation questions in English are available as part of our IBPS Clerk Prelims 2024 Preparation for Bank Exams & Test: Tabulation solutions in Hindi for IBPS Clerk Prelims 2024 Preparation course. Download more important topics, notes, lectures and mock test series for Bank Exams Exam by signing up for free. Attempt Test: Tabulation | 18 questions in 20 minutes | Mock test for Bank Exams preparation | Free important questions MCQ to study IBPS Clerk Prelims 2024 Preparation for Bank Exams Exam | Download free PDF with solutions
Test: Tabulation - Question 1

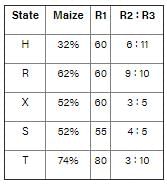
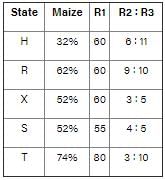
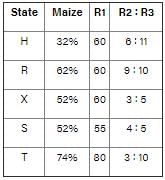
Direction: The table given below shows the production of maize by 5 different states as a percentage of total production. Each state produces only maize and rice. There are three types of rice - R1, R2 and R3. The table also shows the R1 type of rice produced as a percentage of total rice production and the ratio of R2 and R3 type of rice. Total production by each state is 625000.
A = Average of the R3 type of rice produced by state H, R, S and X together.
B = Difference between the R2 type of rice produced by state T and R1 type of rice produced by state R.

What is the value of K/F? (where K = Average of the total production of R1 type of rice by all the states and F = Total production of R2 type of rice by all the states.)

Detailed Solution for Test: Tabulation - Question 1

F = Total production of R2 type of rice by all the states.
⇒ F = (6/17 × 0.4 × 0.68 + 9/19 × 0.4 × 0.38 + 3/8 × 0.4 × 0.48 + 4/9 × 0.45 × 0.48 + 3/13 × 0.2 × 0.26) × 625000
⇒ (0.096 + 0.072 + 0.072 + 0.096 + 0.012) × 625000
⇒ 0.348 × 625000
⇒ 217500
K = Average of the total production of R1 type of rice by all the states.
⇒ Total production of R1 type of rice by all the states = (0.6 × 0.68 + 0.6 × 0.38 + 0.6 × 0.48 + 0.55 × 0.48 + 0.8 × 0.26) × 625000
⇒ (0.408 + 0.228 + 0.288 + 0.264 + 0.208) × 625000
⇒ (1.396) × 625000
⇒ 872500
⇒ K = 872500/5 = 174500
∴ K/F = 174500/217500 = 0.802

Test: Tabulation - Question 2

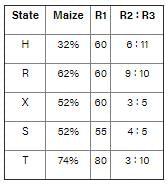
Direction: The table given below shows the production of maize by 5 different states as a percentage of total production. Each state produces only maize and rice. There are three types of rice - R1, R2 and R3. The table also shows the R1 type of rice produced as a percentage of total rice production and the ratio of R2 and R3 type of rice. Total production by each state is 625000.
A = Average of the R3 type of rice produced by state H, R, S and X together.
B = Difference between the R2 type of rice produced by state T and R1 type of rice produced by state R.

What is the value of B - A?

Detailed Solution for Test: Tabulation - Question 2

⇒ R3 type of rice produced by state H = 11/17 × 0.4 × 0.68 × 625000 = 110000
⇒ R3 type of rice produced by state R = 10/19 × 0.4 × 0.38 × 625000 = 50000
⇒ R3 type of rice produced by state S = 5/9 × 0.45 × 0.48 × 625000 = 75000
⇒ R3 type of rice produced by state X = 5/8 × 0.4 × 0.48 × 625000 = 75000
⇒ A = Average of the R3 type of rice produced by state H, R, S and X together
⇒ A = (110000 + 50000 + 75000 + 75000) /4 = 77500
⇒ R2 type of rice produced by state T = 3/13 × 0.2 × 0.26 × 625000 = 7500
⇒ R1 type of rice produced by state R = 0.6 × 0.38 × 625000 = 142500
⇒ B = Difference between the R2 type of rice produced by state T and R1 type of rice produced by state R.
⇒ B = 142500 - 7500 = 135000
∴ B - A = 135000 - 77500 = 57500

1 Crore+ students have signed up on EduRev. Have you? Download the App
Test: Tabulation - Question 3

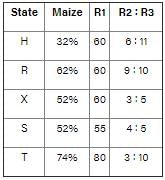
Direction: The table given below shows the production of maize by 5 different states as a percentage of total production. Each state produces only maize and rice. There are three types of rice - R1, R2 and R3. The table also shows the R1 type of rice produced as a percentage of total rice production and the ratio of R2 and R3 type of rice. Total production by each state is 625000.
A = Average of the R3 type of rice produced by state H, R, S and X together.
B = Difference between the R2 type of rice produced by state T and R1 type of rice produced by state R.

Production of R3 type of rice by state X is what percentage of production of R1 type of rice by state S?

Detailed Solution for Test: Tabulation - Question 3

Quantity of rice produced by state X = 0.48 × 625000 = 300000
⇒ (R2 and R3) type of rice produced by state X = 300000 × 0.40 = 120000
⇒ R3 type rice produced in state X = 5/8 × 120000 = 75000
And
⇒ Quantity of rice produced by state S = 625000 × 0.48 = 300000
⇒ R1 type rice produced in state S = 300000 × 0.55 = 165000
∴ Required percentage = (75000/165000) × 100 = 45.45%
A = Average of the R3 type of rice produced by state H, R, S and X together.
B = Difference between the R2 type of rice produced by state T and R1 type of rice produced by state R.

Test: Tabulation - Question 4

Direction: The table given below shows the production of maize by 5 different states as a percentage of total production. Each state produces only maize and rice. There are three types of rice - R1, R2 and R3. The table also shows the R1 type of rice produced as a percentage of total rice production and the ratio of R2 and R3 type of rice. Total production by each state is 625000.
A = Average of the R3 type of rice produced by state H, R, S and X together.
B = Difference between the R2 type of rice produced by state T and R1 type of rice produced by state R.

What is the sum of the total production of maize by state X and T and total production of R2 type of Rice by state S and R?

Detailed Solution for Test: Tabulation - Question 4

Total production of maize by state X and T = 625000 × (0.52 + 0.74) = 787500
Now
⇒ Quantity of rice produced by state S = 625000 × 0.48 = 300000
⇒ (R2 and R3) type of rice produced by state S = 300000 × 0.45 = 135000
⇒ R2 type of rice produced in state S = 4/9 × 135000 = 60000
And
⇒ Quantity of rice produced by state R = 625000 × 0.38 = 237500
⇒ (R2 and R3) type of rice produced by state R = 237500 × 0.4 = 95000
⇒ R2 type of rice produced in state R = 9/19 × 95000 = 45000
⇒ Total production of R2 type of Rice by state S and R = 60000 + 45000 = 105000
∴ Required sum = 787500 + 105000 = 892500

Test: Tabulation - Question 5

Direction: The table given below shows the production of maize by 5 different states as a percentage of total production. Each state produces only maize and rice. There are three types of rice - R1, R2 and R3. The table also shows the R1 type of rice produced as a percentage of total rice production and the ratio of R2 and R3 type of rice. Total production by each state is 625000.
A = Average of the R3 type of rice produced by state H, R, S and X together.
B = Difference between the R2 type of rice produced by state T and R1 type of rice produced by state R.

What is the difference between the R1 type of rice produced by state X and the R2 type of rice produced by state H?

Detailed Solution for Test: Tabulation - Question 5

Rice produced by state X = 48% and that of by state H = 68%
⇒ Quantity of rice produced by state X = 0.48 × 625000 = 300000
⇒ R1 type of rice produced by state X = 300000 × 0.6 = 180000
Now
⇒ Quantity of rice produced by state H = 0.68 × 625000 = 425000
⇒ R1 type of rice produced by state H = 425000 × 0.6 = 255000
⇒ Remaining quantity of rice = 425000 - 255000 = 170000
⇒ R2 type of rice produced by state H = 6/17 × 170000 = 60000
∴ Required difference = 180000 - 60000 = 120000

Test: Tabulation - Question 6

Direction: The table given below shows the income and expenditure (in Rs) of two companies A and B form 2012 to 2016.
Also, Profit = Income - Expenditure
and Profit% = [(Income - Expenditure)/Expenditure] × 100
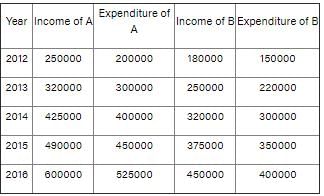
What is the ratio of profit of A in year 2013 and profit of B in year 2016 respectively?

Detailed Solution for Test: Tabulation - Question 6

Profit of A in year 2013 = 3,20,000 - 3,00,000 = Rs. 20,000
Profit of B in year 2016 = 4,50,000 - 4,00,000 = Rs. 50,000
Ratio = 20000/50000 = 2 : 5

Test: Tabulation - Question 7

Direction: The table given below shows the income and expenditure (in Rs) of two companies A and B form 2012 to 2016.
Also, Profit = Income - Expenditure 
and Profit% = [(Income - Expenditure)/Expenditure] × 100
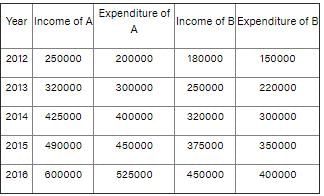
What is the average yearly profit (in Rs) of A for the given years?

Detailed Solution for Test: Tabulation - Question 7

Average income of A = (250000 + 320000 + 425000 + 490000 + 600000)/5 = Rs. 4,17,000
Average expenditure of A = (200000 + 300000 + 400000 + 450000 + 525000)/5= Rs. 3,75,000
Average profit of A = 417000 - 375000 = Rs. 42,000

Test: Tabulation - Question 8

Direction: The table given below shows the income and expenditure (in Rs) of two companies A and B form 2012 to 2016.
Also, Profit = Income - Expenditure 
and Profit% = [(Income - Expenditure)/Expenditure] × 100
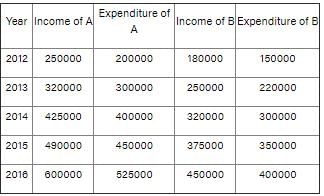
For which year the profit percentage of B is the highest?

Detailed Solution for Test: Tabulation - Question 8

Profit percentage of B for 2012 = (180000 - 150000)/150000 × 100 = 20%
Profit percentage of B for 2013 = (250000 - 220000)/220000 × 100 = 13.64%
Profit percentage of B for 2014 = (320000 - 300000)/300000 × 100 = 6.67%
Profit percentage of B for 2015 = (375000 - 350000)/350000 × 100 = 7.14%
Profit percentage of B for 2016 = (450000 - 400000)/400000 × 100 = 12.5%
The profit percentage of B for 2012 is the highest

Test: Tabulation - Question 9

Direction: The table given below shows the income and expenditure (in Rs) of two companies A and B form 2012 to 2016.
Also, Profit = Income - Expenditure 
and Profit% = [(Income - Expenditure)/Expenditure] × 100
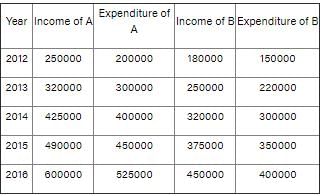
If the income and expenditure of A increases by same rate in 2017 over 2016 as they did in 2016 over 2015, then what is its profit percentage (approximate) in 2017?

Detailed Solution for Test: Tabulation - Question 9

Income of A in 2017 = 600000 × (600000/490000) = Rs. 7,34,693.88
Expenditure of A in 2017 = 525000 × (525000/450000) = Rs. 6,12,500
Profit percent = (734693.88 - 612500)612500 × 100 = 20%

Test: Tabulation - Question 10

Direction: The table given below shows the income and expenditure (in Rs) of two companies A and B form 2012 to 2016.
Also, Profit = Income - Expenditure 
and Profit% = [(Income - Expenditure)/Expenditure] × 100

Compare the profit of Company A wrt to Company B for the year 2014 and find out which company is leading and find profit as well.

Detailed Solution for Test: Tabulation - Question 10
  • From the given data of 2014, we can see that.
  • Profit of Company A = Income - expenditure
  • = 425000 - 400000 = Rs 25000
  • Profit of Company B = Income - Expenditure
  • = 320000 - 300000 = Rs 20000
  • Hence , Company A has more profit of Rs 25000


Test: Tabulation - Question 11

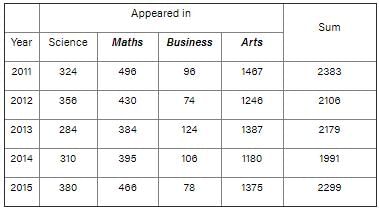
Directions : Study the following table which shows the number of candidates appeared and passed indifferent streams in a School and answer the questions given below it
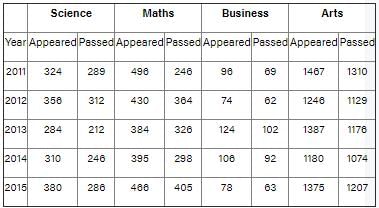
The number of students appearing in all streams was minimum in the year

Detailed Solution for Test: Tabulation - Question 11

From the given data,

As we can see from the given table, the number of students appearing in all streams was minimum in the year 2014

Test: Tabulation - Question 12

Directions : Study the following table which shows the number of candidates appeared and passed indifferent streams in a School and answer the questions given below it
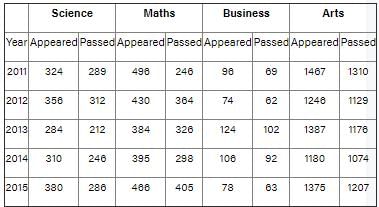
Approximately what per cent of total students appearing in 2014, appeared in Arts stream?

Detailed Solution for Test: Tabulation - Question 12

Total students appearing in 2014 = 310 + 395 + 106 + 1180 = 1991
Students appearing in Arts stream in 2014 = 1180
Per cent of total students appearing in 2014, appeared in Arts stream 

Test: Tabulation - Question 13

Directions : Study the following table which shows the number of candidates appeared and passed indifferent streams in a School and answer the questions given below it
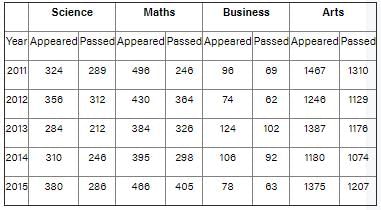
Approximately what percent of students appearing in Maths, passed in 2013?

Detailed Solution for Test: Tabulation - Question 13

Number of students appearing in Maths = 384
Number of students passed in 2013 = 326
Percentage of students appearing in Maths, passed in 2013 

Test: Tabulation - Question 14

Directions: Study the following table and answer the questions: Population of a locality from 1988 to 1992
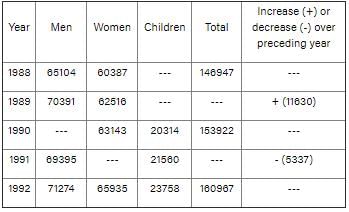
What is the ratio of children and men in 1992?

Detailed Solution for Test: Tabulation - Question 14

The number of children in 1992 is = 23758
The number of men in 1992 is = 71274
Therefore, ratio is 1:3

Test: Tabulation - Question 15

Directions: Study the following table and answer the questions: Population of a locality from 1988 to 1992

Number of women in 1991 is:

Detailed Solution for Test: Tabulation - Question 15

∵ Total population in 1990 = 153922
∵ Decrease I population in 1991 over the preceding year = 5337
∵ Total population in 1991 = 153922 – 5337 = 148585
∴ Number of women in 1991 = 148585 – (69395 + 21560) = 57630

Test: Tabulation - Question 16

Directions: Study the following table and answer the questions: Population of a locality from 1988 to 1992

Number of children in 1989 is:

Detailed Solution for Test: Tabulation - Question 16

∵ Total population in 1988 = 146947
∵ Increase in population in 1989 over preceding year = 11630
∵ Total population in 1989 = 146947 + 11630 = 158577
∴ Number of children in 1989 = 158577 – (70391 + 62516) = 25670

Test: Tabulation - Question 17

Directions: Study the following table and answer the questions: Population of a locality from 1988 to 1992

What is the population of men in 1990?

Detailed Solution for Test: Tabulation - Question 17

∵ Total population in 1990 = 153922
∴ Number of men in 1990 = 153922 – (63143 + 20314) = 70465

Test: Tabulation - Question 18

Directions: Study the following table and answer the questions: Population of a locality from 1988 to 1992

The number of children in 1988 is

Detailed Solution for Test: Tabulation - Question 18

∵ Total population in 1988 = 146947
∴ Number of children in 1988 = 146947 – (65104 + 60387) = 21456

296 videos|297 docs|179 tests
Information about Test: Tabulation Page
In this test you can find the Exam questions for Test: Tabulation solved & explained in the simplest way possible. Besides giving Questions and answers for Test: Tabulation, EduRev gives you an ample number of Online tests for practice

Top Courses for Bank Exams

296 videos|297 docs|179 tests
Download as PDF

Top Courses for Bank Exams