Test: Transportation Engineering- 2 - Civil Engineering (CE) MCQ
15 Questions MCQ Test - Test: Transportation Engineering- 2

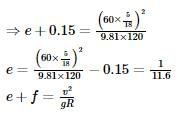
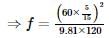
The radius of a horizontal circular curve on a highway is 120 m. The design speed is 60 km/hour, and the design coefficient of lateral friction between the tyre and the road surface is 0.15. The estimated value of superelevation required (if full lateral friction is assumed to develop), and the value of the coefficient of friction needed (if no superelevation is provided) will, respectively, be


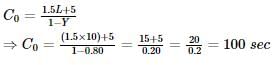
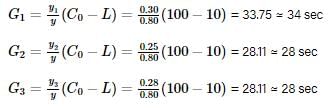
The critical flow ratios for a three-phase signal are found to be 0.30, 0.25, and 0.25. The total time lost in the cycle is 10 s. Pedestrian crossings at this junction are not significant. The respective Green times (expressed in seconds and rounded off to the nearest integer) for the three phases are

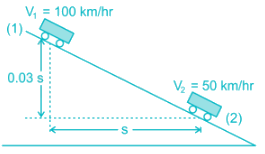
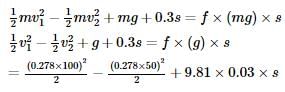
A motorist traveling at 100 km/h on a highway needs to take the next exit, which has a speed limit of 50 km/h. The section of the roadway before the ramp entry has a downgrade of 3% and the coefficient of friction ( f ) is 0.35. In order to enter the ramp at the maximum allowable speed limit, the braking distance (expressed in m) from the exit ramp is _________.
The relation between speed u (in km/h) and density k (number of vehicles / km) for a traffic stream on a road is u = 70 – 0.7k. The capacity on this road is _______________ vph (vehicles/hour).

During a forensic investigation of pavement failure, an engineer reconstructed the graphs P, Q, R and S, using partial and damaged old reports.
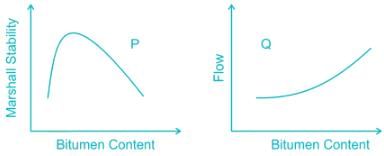
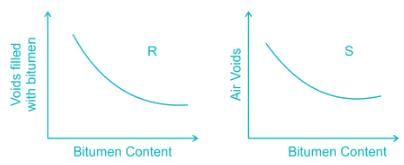
Theoretically plausible correct graphs according to the 'Marshall mixture design output' are
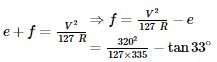
A superspeedway in New Delhi has among the highest super-elevation rates of any track on the Indian Grand Prix circuit. The track requires drivers to negotiate turns with a radius of 335 m and 33° banking. Given this information, the coefficient of side friction required in order to allow a vehicle to travel at 320 km/h along the curve is:
The penetration value of a bitumen sample tested at 25°C is 80. When this sample is heated to 60°C and tested again, the needle of the penetration test apparatus penetrates the bitumen sample by d mm. The value of d CANNOT be less than _______________ mm.
In the context of the IRC 58-2011 guidelines for rigid pavement design, consider the following pair
of statements.
I: Radius of relative stiffness is directly related to the modulus of elasticity of concrete and inversely
related to Poisson's ratio.
II: Radius of relative stiffness is directly related to the thickness of slab and modulus of subgrade
reaction.
Which one of the following combinations is correct?

While traveling along and against the traffic stream, a moving observer measured the relative flows as 50 vehicles/hr and 200 vehicles/hr, respectively. The average speeds of the moving observer while traveling along and against the stream are 20 km/hr and 30 km/hr, respectively. The density of the traffic stream (expressed in vehicles/km) is
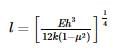
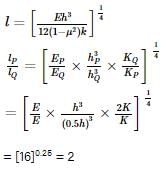
The radii of the relative stiffness of the rigid pavement P and Q are denoted by IP and IQ respectively. The geometric and material properties of the concrete slab and underlying soil are given below.
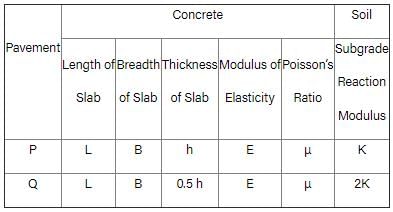
The ratio (up to one decimal place) of IP / IQ is _____.
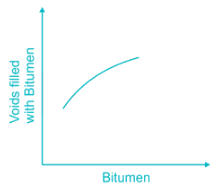
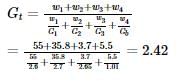
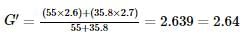
In Marshall method of mix design, the coarse aggregate, fine aggregate, fines and bitumen having respective values of specific gravity 2.60, 2.70, 2.65 and 1.01, are mixed in the relative proportions (% by weight) of 55.0, 35.8, 3.7 and 5.5 respectively. The theoretical specific gravity of the mix and the effective specific gravity of the aggregates in the mix respectively are:
Two cars P and Q are moving in a racing track continuously for two hours. Assume that no other vehicles are using the track during this time. The expressions relating the distance traveled d (in km) and time t (an hour) for both the vehicles are given as
P (d) = 60t
Q (d) = 60t2
Within the first one hour, the maximum space headway would be

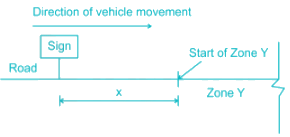
A sign is required to be put up asking drivers to slow down to 30 km/h before entering Zone Y (see figure). On this road, vehicles require 174 m to slow down to 30 km/h (the distance of 174 m includes the distance traveled during the perception-reaction time of drivers). The sign can be read by 6/6 vision drivers from a distance of 48 m. The sign is placed at a distance of x m from the start of Zone Y so that even a 6/9 vision driver can slow down to 30 km/h before entering the zone. The minimum value of x is _______________ m.
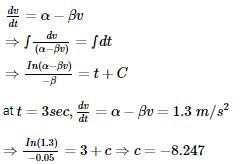
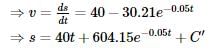
The acceleration-time relationship for a vehicle subjected to non-uniform acceleration is
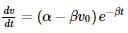
where v is the speed in m/s, t is the time in s, α and β are parameters, and v0 is the initial speed in m/s. If the accelerating behavior of a vehicle, whose driver intends to overtake a slow-moving vehicle ahead, is described as,

Considering 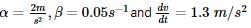 at t = 3 s, the distance (in m) traveled by the vehicle in 35 s is ___.
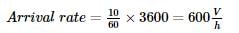
The queue length (in a number of vehicles) versus time (in seconds) plot for an approach to a signalized intersection with the cycle length of 96 seconds is shown in the figure (not drawn to scale).
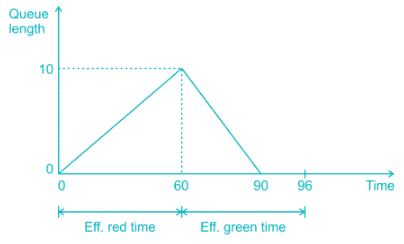
At time = t = 0, the light has just turned red. The effective green time is 36 seconds, during which vehicles discharge at the saturation flow rate, s (in vph). Vehicles arrive at a uniform rate, v (in vph), throughout the cycle. Which one of the following statements is TRUE?

Important Questions for Transportation Engineering- 2
Transportation Engineering- 2 MCQs with Answers
Online Tests for Transportation Engineering- 2
|
© EduRev
|
Education Revolution
|


|


