Test: Use of Statistical Tools- Match Based Type Questions - Commerce MCQ
15 Questions MCQ Test - Test: Use of Statistical Tools- Match Based Type Questions

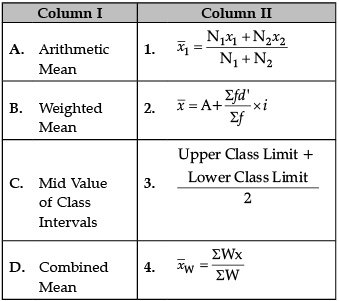
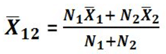
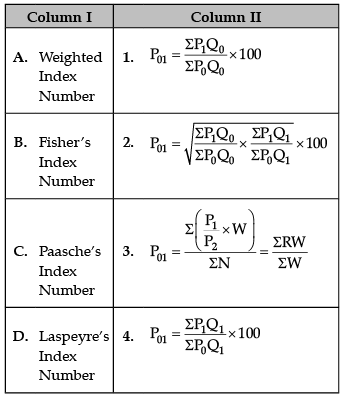
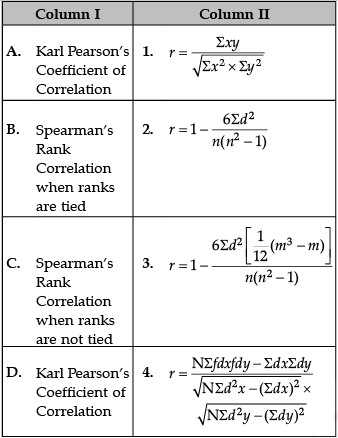
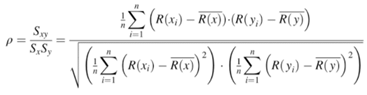
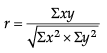
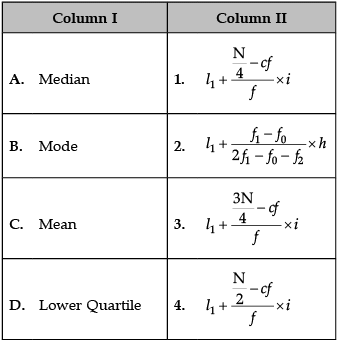
Identify the correct pair of terms with their formula from the following Columns I and II:
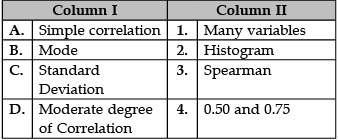
Identify the correct pair of items from the following Columns I and II:

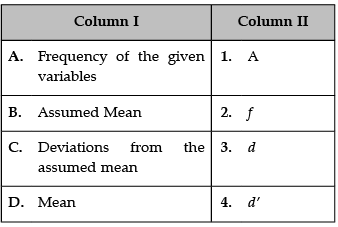
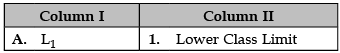
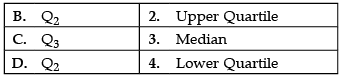
Identify the correct pair of terms with their common symbols from the following Columns I and II:
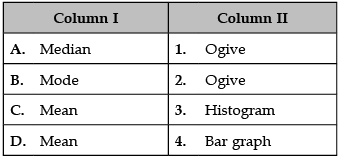
Identify the correct pair of items from the following Columns I and II:
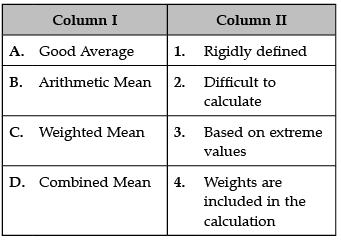
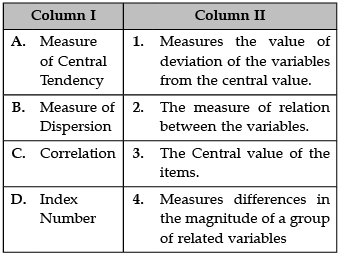
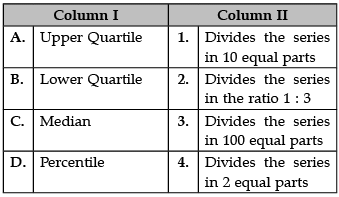
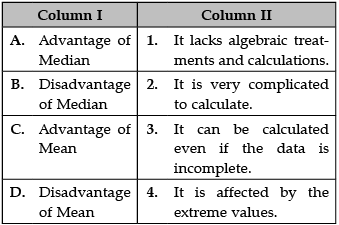
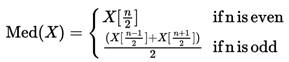
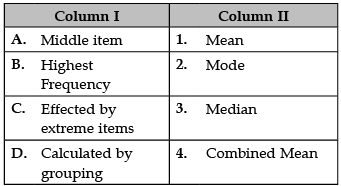
Identify the correct pair of terms and definitions from the following Columns I and II:
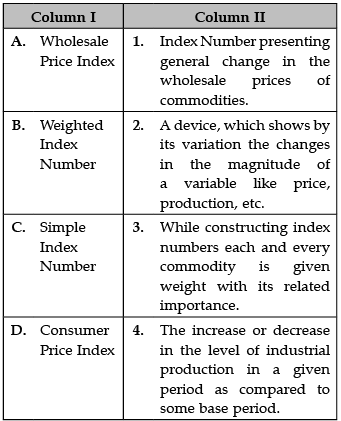
Identify the correct pair of terms with their definition from the following Columns I and II:
Identify the correct pair of items from the following Columns I and II:
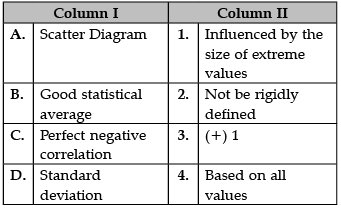
Identify the correct pair of terms and definitions from the following Columns I and II:
Identify the correct pair of items from the following Columns I and II:
Identify the correct pair of items from the following Columns I and II:
Identify the correct pair of terms and definitions from the following Columns I and II:
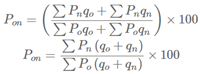
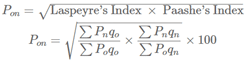
Identify the correct pair of terms with their formulae from the following Columns I and II:

Identify the correct pair of items from the following Columns I and II:
Identify the correct pair of terms and definitions from the following Columns I and II:
Identify the correct pair of terms with their definition from the following Columns I and II:
Important Questions for Use of Statistical Tools- Match Based Type Questions
Use of Statistical Tools- Match Based Type Questions MCQs with Answers
Online Tests for Use of Statistical Tools- Match Based Type Questions
|
© EduRev
|
Education Revolution
|


|


