1 Crore+ students have signed up on EduRev. Have you? |
Which one of the following practices, causes reduction in the per capita water consumption?
Good Quality water, hotter climate and modern living, all these factors will increase the per capita water consumption.
However, metering system will reduce the consumption as people will be cautious while using the water as they need to pay for it.
The multiplying factor, as applied to obtain the maximum daily water demand, in relation to the average i.e. per capita daily demand, is
Maximum daily demand
= 1.8 x Average daily demand Maximum hourly demand
= 1.5 x Maximum daily demand
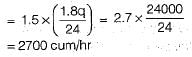
If the average daily water consumption of a city is 24000 cum, the peak hourly demand (of the maximum day) will be
Maximum hourly consumption of the maximum day i.e. peak demand
The total water requirement of a city is generally assessed on the basis of
For general community purposes, the total draft is not taken as the sum of maximum hourly demand and fire demand, but is taken as the sum of maximum daily demand and fire demand, or the maximum hourly demand, whichever is more. The maximum daily demand (i.e. 1.8 times the average daily demand) when added to fire draft,for working out total draft, is known as coincident draft.
As compared to the geometrical increase method of forecasting population, the arithmetical increase method gives.
In geometric increase method compounding is done every decade unlike in arithmetic increase method. Thus geometrical increase method gives higher value than the arithmetic increase method.
The growth of population can be conveniently represented by a curve, which is amenable to mathematical solution, The type of this curve is
Equation of logistic curve is given by,
In [(Ps - P)/(Ps - P0)] = -kPst
where,
P0 = The population at the start pt. of the curve A
Ps = Saturation population
P = Population at any time t from the origin A
K = Constant
The average domestic water consumption per capita per day for an Indian city, as per IS 1172- 1963, may be taken as
The total water consumption per capita per day, including domestic, commercial, and industrial demands, for an average Indian city, as per IS Code, may be taken as
Break up of per capita demand (q) for an average Indian city
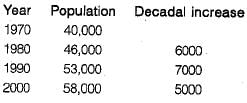
The population figures in a growing town are as follows:
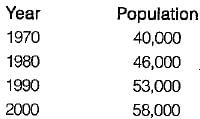
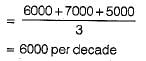
The predicted population in 2010 by Arithmetic Regression method is
∴ Design growth rate,
In 2010 population will be,
P = 58000 + 6000 = 64000
The pipe mains carrying water from the source to the reservoir are designed for the
The pipe mains carrying water from the source to the reservoir are designed for the maximum daily draft = 1.8 times the average daily draft.
However, pipes for distributing water to households etc. are designed for maximum hourly draft of the maximum day = 2.7 times the average daily draft.
26 docs|292 tests
|
Use Code STAYHOME200 and get INR 200 additional OFF
|
Use Coupon Code |
26 docs|292 tests
|
|
|
|
|
|
|
|
|