Olympiad Test: Introduction To Graphs - Class 8 MCQ
20 Questions MCQ Test - Olympiad Test: Introduction To Graphs
Which of the points given is a point on the X-axis?
Direction: The bar-graph provided gives the sales of books (in thousand numbers) by six branches of a publishing company during two consecutive years 2013 and 2014. Sales of books (in thousand numbers) in different branches
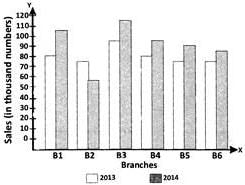
What is the total sales of branches B1, B3 and B5 together for both the years (in thousand numbers)?

The bar-graph provided gives the sales of books (in thousand numbers) by six branches of a publishing company during two consecutive years 2013 and 2014. Sales of books (in thousand numbers) in different branches
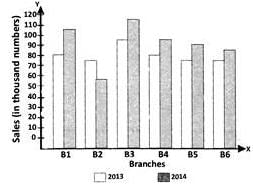
What percent of the total sales of branch B3 for both the years is the total sales of branch B6 for both the years?
The bar-graph provided gives the sales of books (in thousand numbers) by six branches of a publishing company during two consecutive years 2013 and 2014. Sales of books (in thousand numbers) in different branches
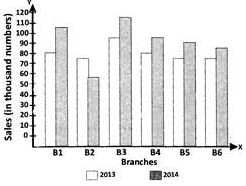
What is the average sale of all the branches (in thousand numbers) for the year 2013?
The bar-graph provided gives the sales of books (in thousand numbers) by six branches of a publishing company during two consecutive years 2013 and 2014. Sales of books (in thousand numbers) in different branches
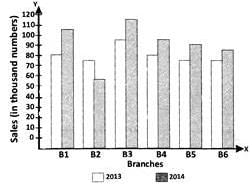
What is the ratio of the total sales of branch B2 for both years to the total sales of branch B4 for both the years
The bar-graph provided gives the sales of books (in thousand numbers) by six branches of a publishing company during two consecutive years 2013 and 2014. Sales of books (in thousand numbers) in different branches
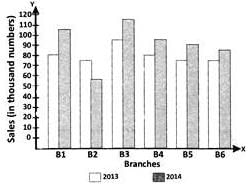
What percent of the average sales of branches B1,B2 and B3 in 2014 is the average sales of branches B1,B3 and B6 in 2013?
Direction: The following pie charts show the distribution of students of graduate and post-graduate levels in seven different institutes M, N , P, Q, R, S and T town.
Total number of students of graduate level = 27300
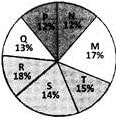
Total number of students of post-graduate level = 24700
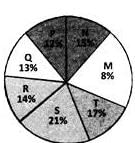
Note: Pie charts are not drawn to scale. How many students of institutes M and S are studying at graduate level?
The following pie charts show the Jistribution of students of graduate and 3ost-graduate levels in seven different institutes M, M P, Q, R, S and Tina town. Distribution of students at graduate and post-graduate levels in seven institutes M, N, P,Q, R, S, and T. Total number of students of graduate level = 27300

Total number of students of post-graduate level = 24700

Note: Pie charts are not drawn to scale. What is the total number of students studying at post-graduate level from institutes N and P?
The following pie charts show the Jistribution of students of graduate and 3ost-graduate levels in seven different institutes M, M P, Q, R, S and Tina town. Distribution of students at graduate and post-graduate levels in seven institutes M, N, P,Q, R, S, and T. Total number of students of graduate level = 27300

Total number of students of post-graduate level = 24700

Note: Pie charts are not drawn to scale. What is the total number of graduate and post-graduate level students in the institute R?
The following pie charts show the Jistribution of students of graduate and 3ost-graduate levels in seven different institutes M, M P, Q, R, S and Tina town. Distribution of students at graduate and post-graduate levels in seven institutes M, N, P,Q, R, S, and T. Total number of students of graduate level = 27300

Total number of students of post-graduate level = 24700

Note: Pie charts are not drawn to scale. What is the total number of graduate and post-graduate level students in the institute R?
The following pie charts show the Jistribution of students of graduate and 3ost-graduate levels in seven different institutes M, M P, Q, R, S and Tina town. Distribution of students at graduate and post-graduate levels in seven institutes M, N, P,Q, R, S, and T. Total number of students of graduate level = 27300

Total number of students of post-graduate level = 24700

Note: Pie charts are not drawn to scale. What is the total number of graduate and post-graduate level students in the institute R?
The bar chart shows the number of workers employed by a trading company in three years.
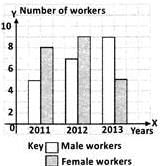
Calculate the difference between the total number of male and female workers employed over those three years.
The line graph shows the sale of dolls by Suhas from Monday to Saturday in a particular week.
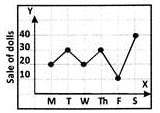
Given that the cost of one doll is Rs.35, how much did Suhas receive from the sale or dolls on Saturday?
The bar chart shows the number of 'Maruti' and 'Benz' cars sold by three dealers, A, B and C.
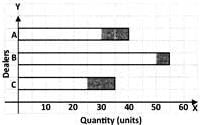
Which of the following statements is true?
The line graph shows the price of chicken in towns M and N.
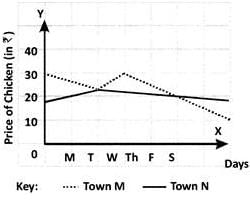
On which days are the price of chicken the same in both the towns?
The line graph shows the sale of watches in a company.
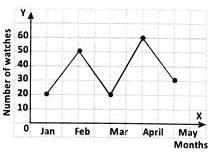
How many watches were sold in all 5 months?
Direction: The line graph shows the monthly expenditure of Vasu's family.
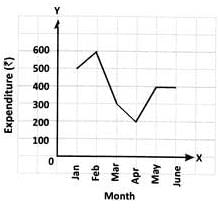
What is the total expenditure over the first 3 months?
Direction: The line graph shows the monthly expenditure of Vasu's family.
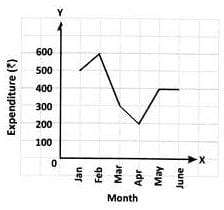
Find the difference between their highest and lowest monthly expenditures.
Which of the following statements is correct?


