Test: Polar Plot - 1 - Electronics and Communication Engineering (ECE) MCQ
15 Questions MCQ Test - Test: Polar Plot - 1

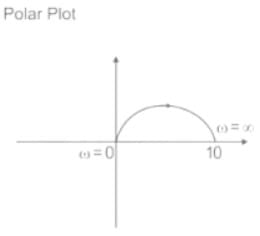
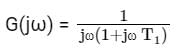
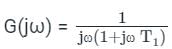
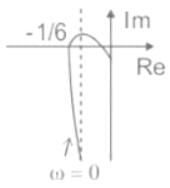
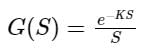
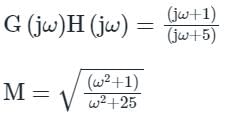
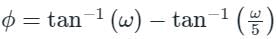
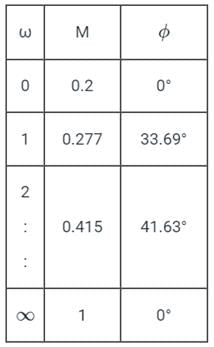
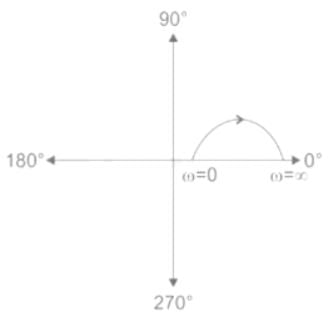
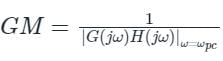
The polar plot of the transfer function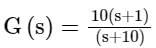 for 0 ≤ ω ≤ ∞ will be in the
for 0 ≤ ω ≤ ∞ will be in the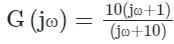 (it is Lead compensator)

Directions: It consists of two statements, one labelled as the ‘Statement (I)’ and the other as ‘Statement (II)’. Examine these two statements carefully and select the answers to these items using the codes given below:
Statement (I): The polar plot has limitation for portraying the frequency response of a system.
Statement (II): The calculation of frequency response is tedious and does not indicate the effect of the individual poles and zeros.
Statement (I): The polar plot has limitation for portraying the frequency response of a system.
Statement (II): The calculation of frequency response is tedious and does not indicate the effect of the individual poles and zeros.
The polar plot of a transfer function with ω as the parameter is known as the
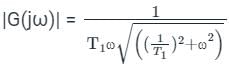
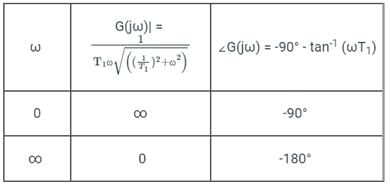
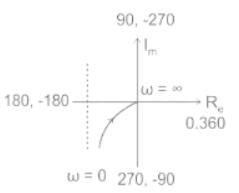
The frequency response of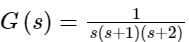 plotted in the complex G(jω) plane (for 0 < ω < ∞) is


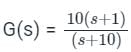
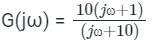
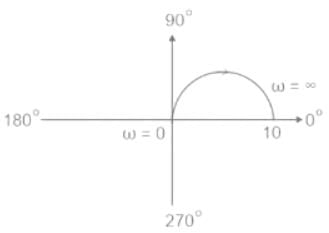
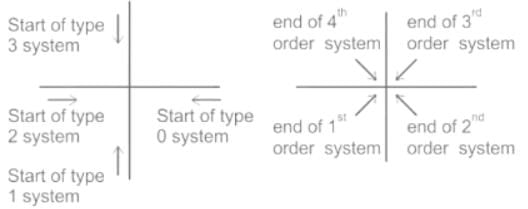
The polar plot of the transfer function G (s) = 10 (s + 1) / (s + 10) will be in the

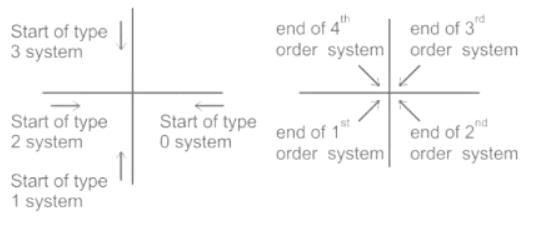
The quadrant at which the polar plot of transfer function lies is ______
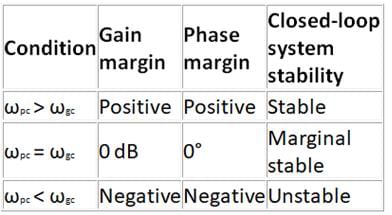
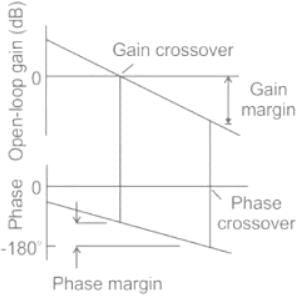
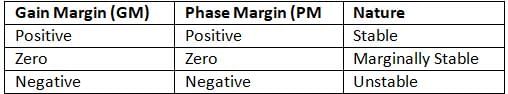
A system with a unity gain margin and zero phase margin is _____

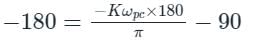
If the constant 'k' is negative, then what would be its contribution to the phase plot:
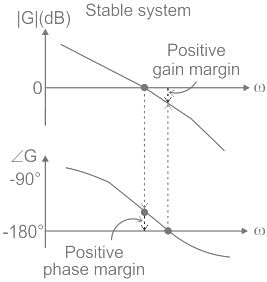
If gain margin and phase margin both are positive, then the system is said to be :
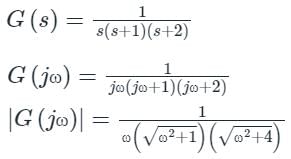
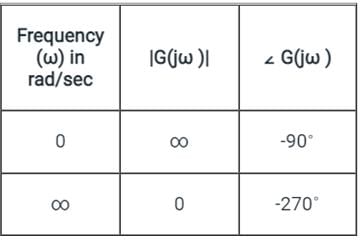
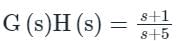
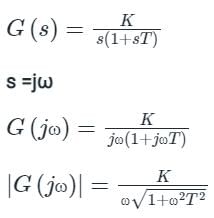
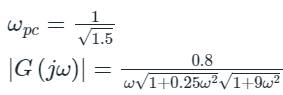
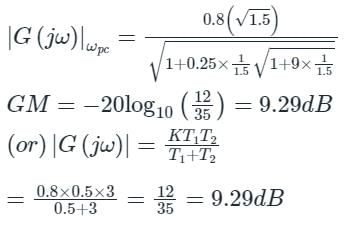
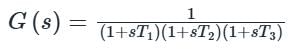
Transfer function of a system is given as
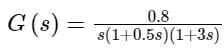
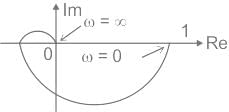
Polar plot of the same system is
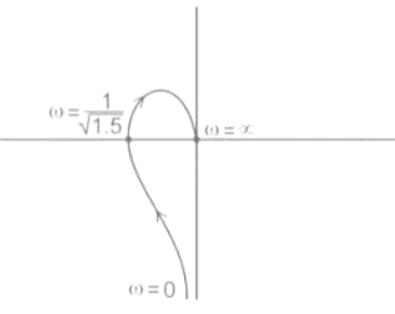
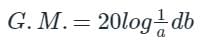
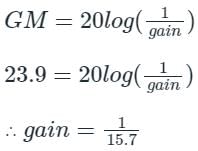
Gain margin (in dB) of the system is ______. (Important - Enter only the numerical value in the answer)
Important Questions for Polar Plot - 1
Polar Plot - 1 MCQs with Answers
Online Tests for Polar Plot - 1
|
© EduRev
|
Education Revolution
|


|


