UPSC Exam  >  UPSC Tests  >  Geography for UPSC CSE  >  Test: Population - 1 - UPSC MCQ

Test: Population - 1 - UPSC MCQ


Test Description

15 Questions MCQ Test Geography for UPSC CSE - Test: Population - 1

Test: Population - 1 for UPSC 2024 is part of Geography for UPSC CSE preparation. The Test: Population - 1 questions and answers have been prepared according to the UPSC exam syllabus.The Test: Population - 1 MCQs are made for UPSC 2024 Exam. Find important definitions, questions, notes, meanings, examples, exercises, MCQs and online tests for Test: Population - 1 below.
Solutions of Test: Population - 1 questions in English are available as part of our Geography for UPSC CSE for UPSC & Test: Population - 1 solutions in Hindi for Geography for UPSC CSE course. Download more important topics, notes, lectures and mock test series for UPSC Exam by signing up for free. Attempt Test: Population - 1 | 15 questions in 18 minutes | Mock test for UPSC preparation | Free important questions MCQ to study Geography for UPSC CSE for UPSC Exam | Download free PDF with solutions
Test: Population - 1 - Question 1

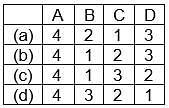
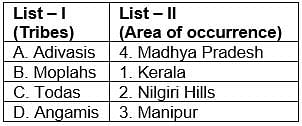
Match the following

Codes:

Detailed Solution for Test: Population - 1 - Question 1

Test: Population - 1 - Question 2

Which factors influence the density distribution of population in India most profoundly?

1. Amount of rainfall

2. Fertility of soils

3. Distribution of minerals

4. Cultural factors

Detailed Solution for Test: Population - 1 - Question 2
Amount of rainfall and the fertility of soil are the factors which influence the density distribution of population in India.

1 Crore+ students have signed up on EduRev. Have you? Download the App
Test: Population - 1 - Question 3

Which one of the Indian state/union Territories is having lowest sex ratio in 2011?

Detailed Solution for Test: Population - 1 - Question 3
Total Population of Daman and Diu is 2.43 Lakhs as per census 2011. Literacy rate in Daman and Diu is 87.10 percent while sex ratio is 618 females per 1000.

Test: Population - 1 - Question 4

As per 2011 census data, the child sex ratio has come down from 927 to

Detailed Solution for Test: Population - 1 - Question 4
As per census 2011 the child sex ratio (0-6 years) is 919 and thus a decline from previous census data.

Test: Population - 1 - Question 5

As per 2011 census data, the sex ratio is

Detailed Solution for Test: Population - 1 - Question 5
In 2011 the sex ratio was 943 and showed an upward trend from previous data of 933 females per thousand males.

Test: Population - 1 - Question 6

Which state of India tops in literacy?

Detailed Solution for Test: Population - 1 - Question 6
The highest literacy rate was in kerala (93.9%).

Test: Population - 1 - Question 7

Name the state where density of population is the lowest

Detailed Solution for Test: Population - 1 - Question 7
Arunachal Pradesh is the least dense populated state (17/km2).

Test: Population - 1 - Question 8

What is the percentage of literacy in India, as per 2011 census data:

Detailed Solution for Test: Population - 1 - Question 8
The percentage of literacy in India was 74.04% as per census, 2011.

Test: Population - 1 - Question 9

Which one of the following is the correct descending order of the three most populous states of India (2011)?

Detailed Solution for Test: Population - 1 - Question 9
According to the State Census 2011, the most populated state in India is Uttar Pradesh with a population of 19.96 crores. Second comes Maharashtra with a population of 112,374,333 and thirdly Bihar having population 104,099,452.

Test: Population - 1 - Question 10

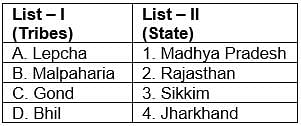
Match List-I with List-II and select the correct answer from the codes given below:
Codes:
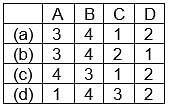
Detailed Solution for Test: Population - 1 - Question 10
  • The Lepchas are the aboriginal inhabitants of Sikkim and they are mostly settled in North Sikkim. They are mostly Buddhist but many of them have now adopted Christianity. The lepcha folklore is melodious and contains lots of interesting folk stories.

  • The Mal Paharia people are a tribal people of Jharkhand. Paharia Mal or Mal Paharia is listed as a Scheduled Tribe by the Government of Jharkhand. As per 2001 census, the Mal Paharias number is around 115,093 in Jharkhand.

  • Gond tribes spread in MP Chhattisgarh.

  • Bhils tribes of India are the largest tribe of South Asia. They are commonly found in the states of Rajasthan and Gujarat.

Test: Population - 1 - Question 11

Consider the following statements and select the correct answer

by using the codes given below:

Assertion (A): There has been some decline in the growth rate of

India’s population in recent years.

Reason (R): According to 2011 census, about 3/4 of Indian’s

the population is literate.

Codes:

Detailed Solution for Test: Population - 1 - Question 11
According to the 2011 census the growth rate of people has declined as there is a rise in literacy rate i.e. 73%.

Test: Population - 1 - Question 12

Consider the following statements:

1. As per census 2011, the population growth rate of Nagaland

during 2001–2011 was the lowest among the states of India.

2. As per census 2011, the population growth rate of Dadra and

Nagar Haveli was the highest among the states of

India/Union territory.

Which of the statements given above is/are correct?

Detailed Solution for Test: Population - 1 - Question 12
Population growth rate of Nagaland was -0.58 percent during the 2001-2011 periods which is the lowest. Dadra and Nagar Haveli District recorded an increase of 59.22 percent to its population compared to 1991 which is the highest.

Test: Population - 1 - Question 13

Arrange the following states in the descending order of literacy as per census report of 2011 and select the correct answer from the codes given at the end.

1. Kerala

2. Manipur

3. Tamil Nadu

4. Himachal Pradesh

Codes:

Detailed Solution for Test: Population - 1 - Question 13
Kerala has the highest literacy rate of 93.91%, after that Himachal Pradesh with 83.78%, Tamil Nadu with 80.33% and then Manipur with 79.85%.

Test: Population - 1 - Question 14

Consider the following specific stages of demographic transition associated with economic development:

1. Low birth rate with low death rate.

2. High birth rate with high death rate.

3. High birth rate with low death rate.

Select the correct order of the above stages using the codes given below:

Codes:

Detailed Solution for Test: Population - 1 - Question 14
In general, impact of economic growth in an economy on the population will show following behaviour, High rate of birth and High rate of deaths - Low population growth (under- developed), High rate of birth and Low rate of deaths - High population growth (developing), Low rate of birth and Low rate of deaths - Low population growth (developed)

Test: Population - 1 - Question 15

Which one of the following years is known as the ‘Year of the Great Divide’ with regard to population, after which there has been a continuous and rapid growth in India’s population?

Detailed Solution for Test: Population - 1 - Question 15
  • The year 1921 is a “year of the great divide” in the demographic history of India when mortality started to decline leading to acceleration in the rate of population growth.

  • During the next three decades (1921-51) the rate of population growth continued at a level of over one per cent per annum. The slight dip in the growth rate in 1941-51 partly reflects the Bengal famine of 1942-43 and dislocation, due to the partition of India in 1947.

180 videos|475 docs|198 tests
Information about Test: Population - 1 Page
In this test you can find the Exam questions for Test: Population - 1 solved & explained in the simplest way possible. Besides giving Questions and answers for Test: Population - 1, EduRev gives you an ample number of Online tests for practice

Top Courses for UPSC

180 videos|475 docs|198 tests
Download as PDF

Top Courses for UPSC