CA Foundation Exam  >  CA Foundation Tests  >  Quantitative Aptitude for CA Foundation  >  Test: Inequalities- 3 - CA Foundation MCQ

Test: Inequalities- 3 - CA Foundation MCQ


Test Description

10 Questions MCQ Test Quantitative Aptitude for CA Foundation - Test: Inequalities- 3

Test: Inequalities- 3 for CA Foundation 2025 is part of Quantitative Aptitude for CA Foundation preparation. The Test: Inequalities- 3 questions and answers have been prepared according to the CA Foundation exam syllabus.The Test: Inequalities- 3 MCQs are made for CA Foundation 2025 Exam. Find important definitions, questions, notes, meanings, examples, exercises, MCQs and online tests for Test: Inequalities- 3 below.
Solutions of Test: Inequalities- 3 questions in English are available as part of our Quantitative Aptitude for CA Foundation for CA Foundation & Test: Inequalities- 3 solutions in Hindi for Quantitative Aptitude for CA Foundation course. Download more important topics, notes, lectures and mock test series for CA Foundation Exam by signing up for free. Attempt Test: Inequalities- 3 | 10 questions in 20 minutes | Mock test for CA Foundation preparation | Free important questions MCQ to study Quantitative Aptitude for CA Foundation for CA Foundation Exam | Download free PDF with solutions
Test: Inequalities- 3 - Question 1

(i) An employer recruits experienced (x) and fresh workmen (y) for his firm under the condition that he cannot employ more than 9 people. x and y can be related by the inequality

Detailed Solution for Test: Inequalities- 3 - Question 1

An employer recruits experienced (x) and fresh workmen (y) for his firm under the condition that he cannot employ more than 9 people, it means he has to recriut less than or equal to 9.
∴ x + y ≤ 9.

Test: Inequalities- 3 - Question 2

On the average experienced person does 5 units of work while a fresh one 3 units of work daily but the employer has to maintain an output of at least 30 units of work per day. This situation can be expressed as

Detailed Solution for Test: Inequalities- 3 - Question 2

On the average experienced person does 5 units of work while a fresh one 3 units of work daily but the employer has to maintain an output of at least 30 units of work per day.
∴ 5x+3y ≥30 , x ≥ 0, y ≥ 0

Test: Inequalities- 3 - Question 3

The rules and regulations demand that the employer should employ not more than 5 experienced hands to 1 fresh one and this fact can be expressed as

Detailed Solution for Test: Inequalities- 3 - Question 3

The rules and regulations demand that the employer should employ not more than 5 experienced hands to 1 fresh one.
so 5y ≥ x .

Test: Inequalities- 3 - Question 4

The union however forbids him to employ less than 2 experienced person to each fresh person. This situation can be expressed as

Detailed Solution for Test: Inequalities- 3 - Question 4

The union however forbids him to employ less than 2 experienced person to each fresh person. 2y ≤ x. or x ≥ 2y.

Test: Inequalities- 3 - Question 5

The graph to express the inequality x + y ≤ 9 is

Detailed Solution for Test: Inequalities- 3 - Question 5

To plot the graph of x + ≤ 9 , first plote the graph of x + y = 9.
It will be a straight line passing through (0 ,9) and (9, 0) .
The graph of inequality is the region satisfying the inequality.
So it is on side of a line.
Now we will check any one point of one side , if it satisfy the inequality then the shading is done on that side or on the other side.
Let us check (0, 0) . 0 + 0 = 0 < 9, so the shading has to be done towards the origin.

Test: Inequalities- 3 - Question 6

The graph to express the inequality 5x + 3y ≥ 30 is

Detailed Solution for Test: Inequalities- 3 - Question 6

To plot the graph of 5x + 3y ≥ 30 , first plote the graph of 5x + 3y = 30.
It will be a straight line passing through (0 ,10) and (6, 0) .
The graph of inequality is the region satisfying the inequality.
So it is one side of a line.
Now we will check any one point of one side , if it satisfy the inequality then the shading is done on that side or on the other side.
Let us check (0, 0) . 0 + 0 = 0 <30, . So the origin does not satisfy the inequality. so the shading has to be done opposite to the origin.

Test: Inequalities- 3 - Question 7

The graph to express the inequality y ≤ (½)x is indicated by

Detailed Solution for Test: Inequalities- 3 - Question 7

To plot the graph of y ≤ (½)x, first plote the graph of y =(½)x
It will be a straight line passing through (0 ,0) and (2, 1) .
The graph of inequality is the region satisfying the inequality.
So it is on one side of a line.
Now we will check any one point of one side , if it satisfy the inequality then the shading is done on that side or on the other side.
As the line passes through origin we can not check (0,0).
Let us check (2,0) , When x = 2, then y = 1. 0 < 1 , So (2,0) satisfy the inequality.
So shading must be towards the point . that is towards x axis.

Test: Inequalities- 3 - Question 8


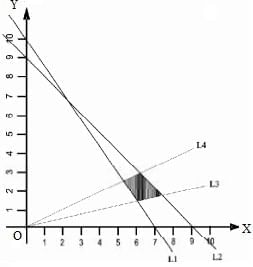
L1 : 5x + 3y = 30 L2 : x+y = 9 L3 : y = x/3 L4 : y = x/2 The common region (shaded part) shown in the diagram refers to

Detailed Solution for Test: Inequalities- 3 - Question 8

The diagram shows the region which is common of the equations of inequality.
We will select one point from the shaded region and write the equations of inequalities.
Lets the consider the point (6, 2.5) and substitute in equations .
5x + 3y = 5(6) + 3(2.5) = 30 + 7.5 = 37.5 > 30
x + y = 6 + 2.5 = 8.5 < 9
x / 3 = 6/3 = 2 < 2.5 < y
So the answer is none of these.

Test: Inequalities- 3 - Question 9

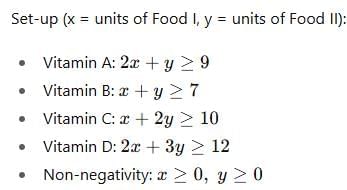
A dietitian wishes to mix together two kinds of food so that the vitamin content of the mixture is at least 9 units of vitamin A, 7 units of vitamin B, 10 units of vitamin C and 12 units of vitamin D. The vitamin content per Kg. of each food is shown below: A B C D Food I : 2 1 1 2 Food II: 1 1 2 3 Assuming x units of food I is to be mixed with y units of food II the situation can be expressed as

Detailed Solution for Test: Inequalities- 3 - Question 9

Test: Inequalities- 3 - Question 10

Graphs of the inequations are drawn below:

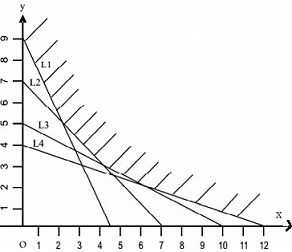
L1 : 2x +y = 9 L2 : x + y = 7 L3 : x+2y= 10 L4 : x + 3y = 12
The common region indicated on the diagram is expressed by the set of inequalities

Detailed Solution for Test: Inequalities- 3 - Question 10

Step 1: Check the shaded region on the graph

From the figure, the shaded region lies above all four lines (towards the top right corner).

That means for each line, instead of "=", we will have "≥".

So, the inequalities should be:

  • 2x + y ≥ 9

  • x + y ≥ 7

  • x + 2y ≥ 10

  • x + 3y ≥ 12

Step 2: Verify with a test point

Take any point from the shaded region, for example (6, 2).

  • For 2x + y: 2(6) + 2 = 12 + 2 = 14, which is greater than 9.

  • For x + y: 6 + 2 = 8, which is greater than 7. 

  • For x + 2y: 6 + 4 = 10, equal to 10. 

  • For x + 3y: 6 + 6 = 12, equal to 12. 

So, point (6, 2) satisfies all inequalities.

Step 3: Also check non-negativity

Since the shaded region is in the first quadrant, x ≥ 0 and y ≥ 0 are also valid.

Final Answer

The common region is given by:

  • 2x + y ≥ 9

  • x + y ≥ 7

  • x + 2y ≥ 10

  • x + 3y ≥ 12

  • x ≥ 0, y ≥ 0

This matches option (c).

101 videos|277 docs|89 tests
Information about Test: Inequalities- 3 Page
In this test you can find the Exam questions for Test: Inequalities- 3 solved & explained in the simplest way possible. Besides giving Questions and answers for Test: Inequalities- 3, EduRev gives you an ample number of Online tests for practice
Download as PDF