Test: Bode Plot - 3 - Electrical Engineering (EE) MCQ
10 Questions MCQ Test - Test: Bode Plot - 3
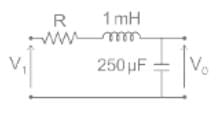
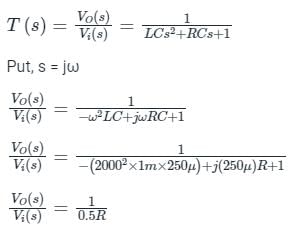
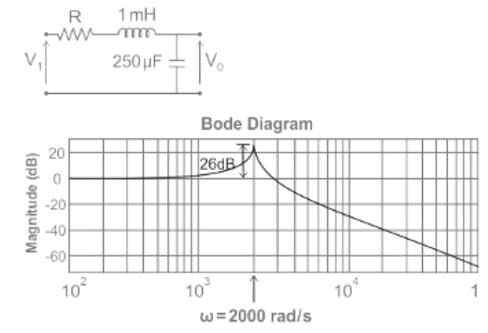
The bode magnitude plot for the transfer function V0(s)/Vi(s) of the circuit is as shown. The value of R is ______ Ω.(Round off to 2 decimal places.)

The figure below shows the Bode magnitude and phase plots of a stable transfer function

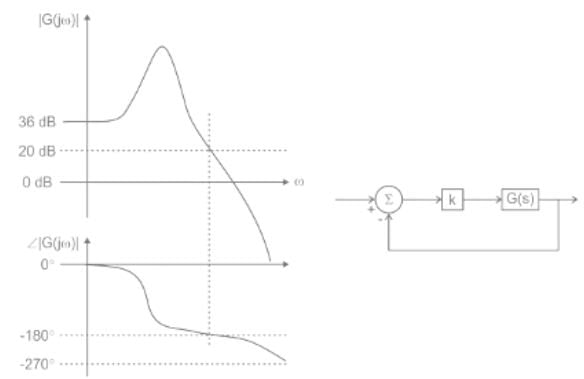
Consider the negative unity feedback configuration with gain in the feedforward path. The closed loop is stable for k < k0. The maximum value of k0 is ______.


Consider the negative unity feedback configuration with gain in the feedforward path. The closed loop is stable for k < k0. The maximum value of k0 is ______.
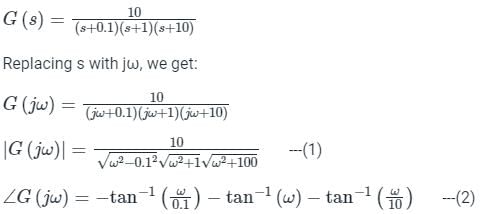
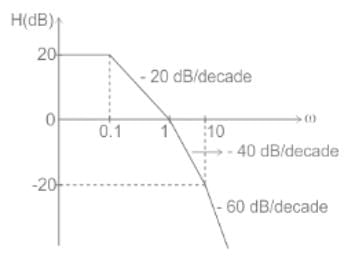
Phase margin in degree of G(s) =  Using asymptotic Bode plot is _____
 Using asymptotic Bode plot is _____
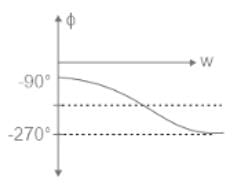
For the system having open loop transfer function . Bode phase plote is shown below. What is the value of 'N'
An op-amp based programmable gain amplifier with a negative feedback is designed. Which method will be the best suitable for the stability analysis?
A unity feedback system has a transfer function -

Find its gain margin.
For an LTI system, the Bode plot for its gain is as illustrated in the figure shown. The number of system poles Np and the number of system zeros Nz in the frequency range 1 Hz ≤ f ≤ 107 Hz is

The forward path transfer function L(s) of the control system shown in Figure (a) has the asymptotic Bode plot shown in Figure (b). If the disturbance d(t) is given by d (t) 0.1sin(ωt) where ω = 5 rad/s, the steady-state amplitude of the output y(t) is


Consider the following asymptotic Bode magnitude plot (ω is in rad/s).

Which one of the following transfer functions is best represented by the above Bode magnitude plot?
What will be the Gain Margin (GM) and the Phase Margin (PM) of a closed loop
TF T(s) = 500000/(s2 + 700s + 250000) ?


