NEET Exam  >  NEET Tests  >  Biology Class 12  >  Test: Organisms & Populations - 1 - NEET MCQ

Test: Organisms & Populations - 1 - NEET MCQ


Test Description

30 Questions MCQ Test Biology Class 12 - Test: Organisms & Populations - 1

Test: Organisms & Populations - 1 for NEET 2025 is part of Biology Class 12 preparation. The Test: Organisms & Populations - 1 questions and answers have been prepared according to the NEET exam syllabus.The Test: Organisms & Populations - 1 MCQs are made for NEET 2025 Exam. Find important definitions, questions, notes, meanings, examples, exercises, MCQs and online tests for Test: Organisms & Populations - 1 below.
Solutions of Test: Organisms & Populations - 1 questions in English are available as part of our Biology Class 12 for NEET & Test: Organisms & Populations - 1 solutions in Hindi for Biology Class 12 course. Download more important topics, notes, lectures and mock test series for NEET Exam by signing up for free. Attempt Test: Organisms & Populations - 1 | 30 questions in 30 minutes | Mock test for NEET preparation | Free important questions MCQ to study Biology Class 12 for NEET Exam | Download free PDF with solutions
Test: Organisms & Populations - 1 - Question 1

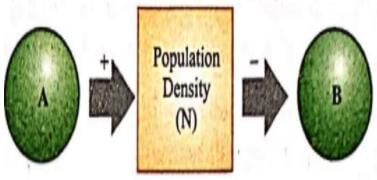
The density of a population in a given habitat during a given period, fluctuates due to changes in certain basic processes. On this basis, fill up boxes A and B in the given flow chart with correct option.
Detailed Solution for Test: Organisms & Populations - 1 - Question 1

The population density in a given habitat and at a particular time period, fluctuates due to the changes in four basic processes given below:-

1. Natality- It refers to the number of births take place in a population during a given period.

2. Mortality- It refers to the number of deaths take place in a population during a given period.

3. Immigration- It refers to the number of individuals of the same species have migrated into the habitat from somewhere else during a particular time period.

4. Emigration- It refers to the number of individuals of the same species have migrated out of the habitat during a given time period.

Natality and immigration add to the population density whereas mortality and emigration decrease the population density.

Topic in NCERT: Population Dynamics

Line in NCERT: "the density of a population in a given habitat during a given period, fluctuates due to changes in four basic processes, two of which (natality and immigration) contribute to an increase in population density and two (mortality and emigration) to a decrease."

Test: Organisms & Populations - 1 - Question 2

What does the shape of the given age pyramids reflects about the growth status of the related population?

Detailed Solution for Test: Organisms & Populations - 1 - Question 2

Triangular age pyramid has high proportion of reproductive individuals, moderate number of reproductive individuals and fewer post-reproductive individuals. It represents young or rapidly growing population.

In urn-shaped age pyramid, the number of reproductive individuals is higher than the number of pre-reproductive individuals. It represents declining or diminishing population with negative growth

In bell-shaped age pyramid, the number of pre-reproductive and reproductive individuals is almost equal. Post reproductive individuals are comparatively fewer. It represents stable or stationary population where growth rate is nearly zero.

Topic in NCERT: Age Pyramids and Population Growth Status

Line in NCERT: "The shape of the pyramids reflects the growth status of the population - (a) whether it is growing, (b) stable or (c) declining."

Test: Organisms & Populations - 1 - Question 3

In a pond, last year there were 30 lotus plants. Through reproduction, 25 new lotus plants were added in one year while 8 plants died. The birth and death rates for the lotus population respectively are ___ and ____ individuals per lotus per year.

Detailed Solution for Test: Organisms & Populations - 1 - Question 3

Total number of plants (in the beginning ) = 30
New plants added by reproduction = 25
Birth rate (of a population)
= New plants / Total number of plants = 25/30
=0.83 individuals per lotus per year
Number of plants died =8
Death rate (of a population) = number of deaths /Total number of plants
= 8/30 = 0.26 individuals per lotus per year.

Test: Organisms & Populations - 1 - Question 4

Which of the following is not an example of using relative density to measure population density in a certain area?

Detailed Solution for Test: Organisms & Populations - 1 - Question 4

Sometimes, for certain ecological investigations, there is no need to know the absolute population densities. Relative densities serve the purpose equally well. In this case, population size is indirectly estimated without actually counting them. For example, the number of fishes caught per trap is good enough measure of its total population density in the lake. The tiger census in our National parks and tiger reserves is often based on pug marks (animal's foot print) and faecal pellets.

Test: Organisms & Populations - 1 - Question 5

Total number of individuals of a species per unit area and per unit time is called:

Detailed Solution for Test: Organisms & Populations - 1 - Question 5

Population density is the number of individuals present per unit area or volume at a given time. If the total number of individuals is represented by letter N and the number of units of space (area for land organisms and volume for water organisms) by letter S, then the population density D can be represented as D =N/S. For instance, number of animals per square kilometer, number of trees per acre in a forest, etc.

Topic in NCERT: Population Density

Line in NCERT: "the density of a population in a given habitat called population density (designated as N)"

Test: Organisms & Populations - 1 - Question 6

Percentage of individuals of a given age group in a given population is called as

Detailed Solution for Test: Organisms & Populations - 1 - Question 6

Age distribution is percentage of individuals of a given age or age group. A population at any given time is composed of individuals of different ages. If age distribution is plotted for the population, the resulting structure is called as age pyramid.

Topic in NCERT: Population Dynamics and Age Structure

Line in NCERT: "The proportion of different age groups of males and females in a population is often presented graphically as age pyramid; its shape indicates whether a population is stationary, growing or declining."

Test: Organisms & Populations - 1 - Question 7

In a given population of 2000 individuals, 80 births and 125 deaths were reported over a given period of time. Which of the following graphs will correspond to it?

Detailed Solution for Test: Organisms & Populations - 1 - Question 7

Number of deaths is more than the number of births, showing a declining population.

Test: Organisms & Populations - 1 - Question 8

Parameters related to age structure include

Detailed Solution for Test: Organisms & Populations - 1 - Question 8

The age structure of a population is the percentage of individuals of different ages such as young, adult and old. 
Age structure is shown by organisms in which individuals of  more than one generation time are important related to it. 

Topic in NCERT: Population Attributes

Line in NCERT: "Another attribute characteristic of a population is sex ratio."

Test: Organisms & Populations - 1 - Question 9

Which of the following factors has a negative effect on the population growth rate?

Detailed Solution for Test: Organisms & Populations - 1 - Question 9

migration is permanent outward movement of individuals from a population for settlement into a new area. If decreases the local population.

Topic in NCERT: POPULATION DYNAMICS

Line in NCERT: "two (mortality and emigration) to a decrease."

Test: Organisms & Populations - 1 - Question 10

If N  population density at time t, then population density at time t+1 can be written as

Nt +1=Nt +[(A+B)−(C+D)]
Select the correct option for A, B, C and D in the above equation. 

Detailed Solution for Test: Organisms & Populations - 1 - Question 10

A and B are natality and immigration. They add to population density. C and D are mortality and emigration. They decrease population density.

Topic in NCERT: Population Growth Models

Line in NCERT: "Nt+1 = Nt + [(B + I) - (D + E)]"

Test: Organisms & Populations - 1 - Question 11

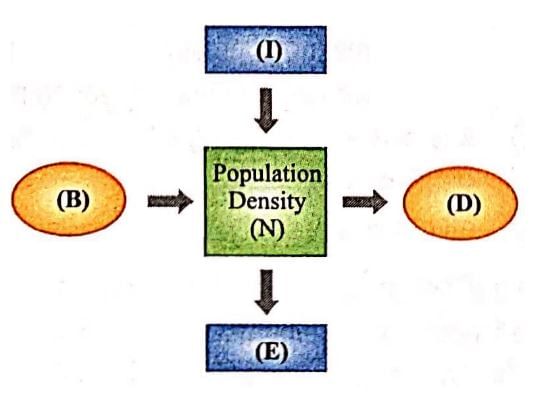
The given figure represents different factors affecting population density (N) If B = nasality, D = mortality, E = emigration and I = immigration; then select the incorrect option regarding these.
Detailed Solution for Test: Organisms & Populations - 1 - Question 11

Immigration is not necessarily equal to emigration in a population.

Topic in NCERT: Population Density Factors

Line in NCERT: "Under normal conditions, births and deaths are the most important factors influencing population density, the other two factors assuming importance only under special conditions."

Test: Organisms & Populations - 1 - Question 12

Exponential growth is observed in a population when

Detailed Solution for Test: Organisms & Populations - 1 - Question 12

When food and space for a population are unlimited, each species has the ability to realise fully its inherited potential to grow. Then the population grows in an exponential or geometric ratio.

Topic in NCERT: Exponential Growth

Line in NCERT: "Ideally, when resources in the habitat are unlimited, each species has the ability to realise fully its innate potential to grow in number, as Darwin observed while developing his theory of natural selection. Then the population grows in an exponential or geometric fashion."

Test: Organisms & Populations - 1 - Question 13

In a population per capita birth rate is 0.15 and per capita death rate is 0.08 during a unit time period. What is the value of r (intrinsic rate of natural increase) for the given population?

Detailed Solution for Test: Organisms & Populations - 1 - Question 13

Intrinsic rate of natural increase (r)

= Birth rate − death rate

=0.15−0.08=0.07

Topic in NCERT: Intrinsic Rate of Natural Increase

Line in NCERT: "The r in this equation is called the ‘intrinsic rate of natural increase' and is a very important parameter chosen for assessing impacts of any biotic or abiotic factor on population growth."

Test: Organisms & Populations - 1 - Question 14

The maximum possible number of individuals that a habitat can support is called its

Detailed Solution for Test: Organisms & Populations - 1 - Question 14

In nature, a given habitat has resources to support a certain number of individuals of a population, beyond which no further growth is possible. This limit is called as nature's carrying capacity (K) for that species in that habitat.

Topic in NCERT: Carrying Capacity

Line in NCERT: "In nature, a given habitat has enough resources to support a maximum possible number, beyond which no further growth is possible. Let us call this limit as nature's carrying capacity (K) for that species in that habitat."

Test: Organisms & Populations - 1 - Question 15

Which of the following equations correctly represents verhulst-Pearl logistic growth?

Detailed Solution for Test: Organisms & Populations - 1 - Question 15

S-shaped growth curve is also called Verhulst-Pearl logistic curve and is represented by the following equation :

where dN/dt= rate of change in population size, r= intrinsic rate of natural increase, N= population density, K= carrying capacity and 

Topic in NCERT: Logistic Growth

Line in NCERT: "This type of population growth is called Verhulst-Pearl Logistic Growth and is described by the following equation: dN/dt = rN(K-N)"

Test: Organisms & Populations - 1 - Question 16

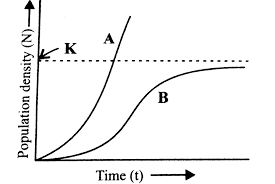
Study the population growth curves (A and B) in the given graph and select the incorrect option
Detailed Solution for Test: Organisms & Populations - 1 - Question 16

Since resources of growth for most animal populations are finite and become limiting sooner or later, the logistic growth model is considered as more realistic.

Topic in NCERT: Logistic Growth Model

Line in NCERT: "Since resources for growth for most animal populations are finite and become limiting sooner or later, the logistic growth model is considered a more realistic one."

Test: Organisms & Populations - 1 - Question 17

In a life table, the number of individuals alive at the beginning of the 1 st year to 2 nd year interval is 800. During this interval, 200 individuals die. The death rate for this interval is 

Detailed Solution for Test: Organisms & Populations - 1 - Question 17

Test: Organisms & Populations - 1 - Question 18

In a laboratory population of fruit flies, if 4 individuals died during a specified time interval and the population had 40 fruit flies, what is the death rate?

Detailed Solution for Test: Organisms & Populations - 1 - Question 18

In the given scenario, the laboratory population of fruit flies consists of 40 fruit flies, and during a specified time interval, 4 individuals died. To calculate the death rate, we divide the number of deaths by the total population.

Number of deaths = 4
Total population = 40

Death rate = Number of deaths / Total population
= 4 / 40
= 0.1 individuals per fruitfly per week

Option a) "0.1 individuals per fruitfly per week" is the correct answer because it accurately represents the death rate calculated based on the given information.

Topic in NCERT: Population Dynamics

Line in NCERT: "If 4 individuals in a laboratory population of 40 fruitflies died during a specified time interval, say a week, the death rate in the population during that period is 4/40 = 0.1 individuals per fruitfly per week."

Test: Organisms & Populations - 1 - Question 19

An age pyramid with a wide base and narrow top indicates a population that is:

Detailed Solution for Test: Organisms & Populations - 1 - Question 19

An age pyramid with a wide base and narrow top indicates a population that is growing rapidly.

In an age pyramid, the width of each age group represents the proportion or percentage of individuals in that specific age group. A wide base indicates a larger population of young individuals, while a narrow top indicates a smaller population of older individuals.

When the base of an age pyramid is wide and the subsequent age groups gradually decrease in width towards the top, it suggests that there is a higher proportion of young individuals compared to older individuals. This is indicative of a population that is growing rapidly because there is a high birth rate.

Topic in NCERT: Age Pyramids and Population Growth Status

Line in NCERT: "The shape of the pyramids reflects the growth status of the population - (a) whether it is growing, (b) stable or (c) declining."

Test: Organisms & Populations - 1 - Question 20

Interacting members of species live close to each other in following interaction/s:

Detailed Solution for Test: Organisms & Populations - 1 - Question 20

Interacting members of species live close to each other in commensalism, predation and parasitism.

Topic in NCERT: Population Interactions

Line in NCERT: "Predation, parasitism and commensalism share a common characteristic, the interacting species live closely together."

Test: Organisms & Populations - 1 - Question 21

For which of the following would you expect distribution range to be badly affected if average Global temperature keeps increasing:

Detailed Solution for Test: Organisms & Populations - 1 - Question 21

A majority of organisms are restricted to narrow range of temperature. Such organisms are called stenothermal species. The distribution range of these species will be adversely affected if average global temperature keeps increasing.

Test: Organisms & Populations - 1 - Question 22

Ecology is the study of the relationships between living organisms and:

Detailed Solution for Test: Organisms & Populations - 1 - Question 22

Ecology is the study of the relationships between living organisms and the abiotic (physico-chemical factors) and biotic components (other species) of their environment. Ecology encompasses the interactions and relationships between organisms and both their non-living (abiotic) and living (biotic) environment. It examines how organisms interact with factors such as climate, water, soil, and other organisms.

Therefore, option a) Abiotic and biotic components accurately describes the scope of ecology.

Topic in NCERT: ECOLOGY

Line in NCERT: "Ecology is the study of the relationships of living organisms with the abiotic (physico-chemical factors) and biotic components (other species) of their environment."

Test: Organisms & Populations - 1 - Question 23

Which type of interaction benefits both species involved?

Detailed Solution for Test: Organisms & Populations - 1 - Question 23

Interactions between species can have different outcomes. In mutualism, both species benefit from the interaction. This means that there is a mutually beneficial relationship where both species gain advantages, such as access to food, protection, or reproductive assistance.

Option d) Mutualism is the correct answer because it accurately identifies the type of interaction where both species involved benefit from each other.

Topic in NCERT: Interspecific Interactions

Line in NCERT: "Both the species benefit in mutualism and both lose in competition in their interactions with each other."

Test: Organisms & Populations - 1 - Question 24

Which principle states that the superior competitor eliminates the inferior one in competition?

Detailed Solution for Test: Organisms & Populations - 1 - Question 24

The principle that states that the superior competitor eliminates the inferior one in competition is the Competitive Exclusion Principle. This principle suggests that when two species compete for the same limited resources in an ecological niche, the species that is better adapted or more efficient at utilizing those resources will eventually outcompete and eliminate the other species from that particular niche.

The correct answer is option a) Competitive exclusion principle. This principle highlights the competitive interactions between species and how competition can lead to the exclusion of one species by another in certain ecological niches.

Topic in NCERT: Competition

Line in NCERT: "Gause's 'Competitive Exclusion Principle' states that two closely related species competing for the same resources cannot co-exist indefinitely and the competitively inferior one will be eliminated eventually."

Test: Organisms & Populations - 1 - Question 25

Exponential growth pattern in a population results into:

Detailed Solution for Test: Organisms & Populations - 1 - Question 25

Exponential growth pattern in population results into j-shaped curve. During exponential growth faster growth occurs and j-shaped curve is formed when time v/s growth is drawn.

Topic in NCERT: Population Growth Models

Line in NCERT: "The above equation describes the exponential or geometric growth pattern of a population (Figure 11.3) and results in a J-shaped curve when we plot N in relation to time."

Test: Organisms & Populations - 1 - Question 26

In which of the following interaction/s one species is benefitted while other is harmed?

Detailed Solution for Test: Organisms & Populations - 1 - Question 26

In predation and parasitism one species is benefitted while other is harmed. Parasite obtain food from host by harming them.

Topic in NCERT: Predation

Line in NCERT: "In both parasitism and predation only one species benefits (parasite and predator, respectively) and the interaction is detrimental to the other species (host and prey, respectively)."

Test: Organisms & Populations - 1 - Question 27

Which growth pattern occurs when resources become progressively limiting in a population?

Detailed Solution for Test: Organisms & Populations - 1 - Question 27

Populations grow through births and immigration and decline through deaths and emigration.

When resources become progressively limiting for a population, the growth pattern turns logistic. This means that initially, the population may experience exponential growth when resources are abundant and unlimited.

However, as resources start to become scarce and limiting, the growth rate of the population slows down and eventually levels off. This pattern is known as logistic growth.

  • Exponential growth (option b) refers to a rapid and unrestricted increase in population size without resource limitations.
  • Constant growth (option c) implies a steady and consistent growth rate over time, regardless of resource availability.
  • Declining growth (option d) suggests a decrease in population size over time, often due to factors like limited resources or environmental disturbances.

Topic in NCERT: Logistic Growth

Line in NCERT: "When resources become progressively limiting, the growth pattern turns logistic."

Test: Organisms & Populations - 1 - Question 28

Orchid shows commensalism on interaction with:

Detailed Solution for Test: Organisms & Populations - 1 - Question 28

Commensalism is interaction in which one species is benefited by other is neither benefited nor harmed. Orchids growing on mango tree do not harm the mango plants but get shelter.

Topic in NCERT: Commensalism

Line in NCERT: "An orchid growing as an epiphyte on a mango branch, and barnacles growing on the back of a whale benefit while neither the mango tree nor the whale derives any apparent benefit."

Test: Organisms & Populations - 1 - Question 29

The birth rate if 7 new plants are added to previous year plant population of 23 Salvinia plants will be:

Detailed Solution for Test: Organisms & Populations - 1 - Question 29

The birth rate of a population = new individual added / previous population. Here birth rate= 7/23=0.3043. Hence, birth rate of Salvinia plants is equal to 0.3.

Test: Organisms & Populations - 1 - Question 30

A statement 933 females per 1000 males depict:

Detailed Solution for Test: Organisms & Populations - 1 - Question 30

Sex ratio is the no of female available per thousands of male in a population. Sex ratio is decline due to female feticides alarmingly in some part of India.

Topic in NCERT: Population Attributes

Line in NCERT: "Another attribute characteristic of a population is sex ratio."

78 videos|277 docs|174 tests
Information about Test: Organisms & Populations - 1 Page
In this test you can find the Exam questions for Test: Organisms & Populations - 1 solved & explained in the simplest way possible. Besides giving Questions and answers for Test: Organisms & Populations - 1, EduRev gives you an ample number of Online tests for practice
78 videos|277 docs|174 tests
Download as PDF