UPSC  >  CSAT Preparation  >  Test: Venn Diagrams- 1 Download as PDF

Test: Venn Diagrams- 1 - UPSC


Test Description

10 Questions MCQ Test CSAT Preparation - Test: Venn Diagrams- 1

Test: Venn Diagrams- 1 for UPSC 2023 is part of CSAT Preparation preparation. The Test: Venn Diagrams- 1 questions and answers have been prepared according to the UPSC exam syllabus.The Test: Venn Diagrams- 1 MCQs are made for UPSC 2023 Exam. Find important definitions, questions, notes, meanings, examples, exercises, MCQs and online tests for Test: Venn Diagrams- 1 below.
Solutions of Test: Venn Diagrams- 1 questions in English are available as part of our CSAT Preparation for UPSC & Test: Venn Diagrams- 1 solutions in Hindi for CSAT Preparation course. Download more important topics, notes, lectures and mock test series for UPSC Exam by signing up for free. Attempt Test: Venn Diagrams- 1 | 10 questions in 20 minutes | Mock test for UPSC preparation | Free important questions MCQ to study CSAT Preparation for UPSC Exam | Download free PDF with solutions
1 Crore+ students have signed up on EduRev. Have you? Download the App
Test: Venn Diagrams- 1 - Question 1

Shyam visited Ram during his brief vacation. In the mornings they both would go for yoga. In the evenings they would play tennis. To have more fun, they indulge only in one activity per day, i.e. either they went for yoga or played tennis each day. There were days when they were lazy and stayed home all day long. There were 24 mornings when they did nothing, 14 evenings when they stayed at home, and a total of 22 days when they did yoga or played tennis. For how many days Shyam stayed with Ram?

Detailed Solution for Test: Venn Diagrams- 1 - Question 1

Let the number of days in the vacation be x
They played tennis for x - 14 days
They did yoga for x - 24 days
So, they did yoga or played tennis for x - 14 + x - 24 = 2x - 38 days
2x – 38 = 22
=> x = 30

Test: Venn Diagrams- 1 - Question 2

Each of these questions given below contains three elements. These elements may or may not have some inter linkage. Each group of elements may fit into one of these diagrams at (A), (B), (C), (D) and/or (E). You have to indicate the group of elements which correctly fits into the diagrams.

Q.

Which of the following diagrams indicates the best relation between Travelers, Train and Bus ?

Detailed Solution for Test: Venn Diagrams- 1 - Question 2

The best relation between Travelers, Train, and Bus can be represented in a Venn diagram, where Travelers are represented as a larger circle containing both Train and Bus circles. This is because travelers can choose either train or bus as their mode of transportation, and some may use both. Here's the explanation:
Travelers
- Travelers are people who move from one place to another for various reasons, such as work, leisure, or other purposes.
Train
- A train is a mode of transportation that runs on a railway track and can carry passengers or goods.
- Some travelers may choose to travel by train due to various factors such as cost, comfort, or availability.
Bus
- A bus is a mode of transportation that runs on roads and can carry passengers.
- Some travelers may choose to travel by bus due to factors such as cost, convenience, or accessibility.
Venn Diagram: Option C
- In option C, we have a large circle representing Travelers, which includes two smaller circles representing Train and Bus.
- This diagram shows that there are travelers who use trains, travelers who use buses, and some travelers who may use both modes of transportation.
- This representation captures the relationship between travelers and their choice of transportation, whether it's by train, bus, or both.

Test: Venn Diagrams- 1 - Question 3

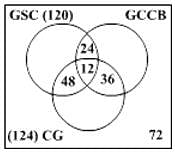
There are 3 clubs A, B & C in a town with 40, 50 & 60 members respectively. While 10 people are members of all 3 clubs, 70 are members in only one club. How many belong to exactly two clubs?
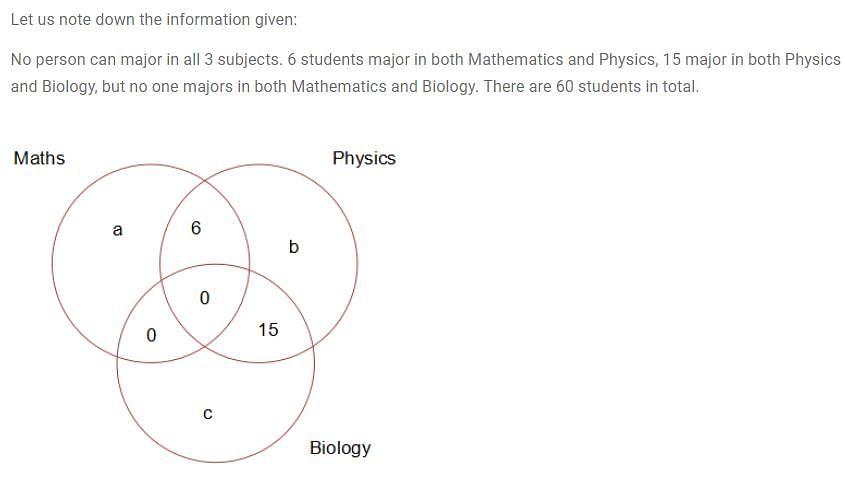
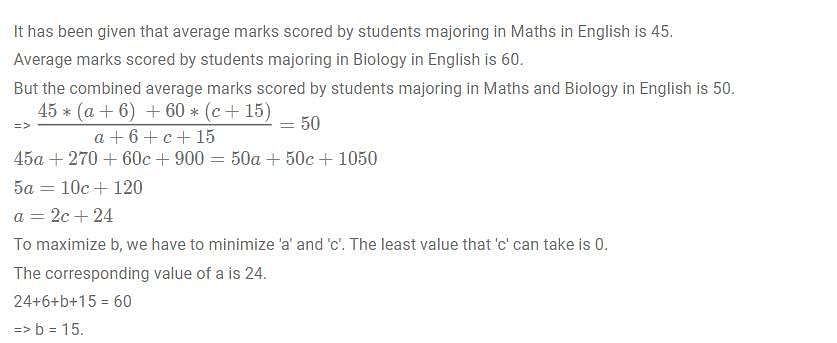
Detailed Solution for Test: Venn Diagrams- 1 - Question 3

We know that x + y + z = T and x + 2y + 3z = R, where
x = number of members belonging to exactly 1 set = 70
y = number of members belonging to exactly 2 sets
z = number of members belonging to exactly 3 sets = 10
T = Total number of members
R = Repeated total of all the members = (40 + 50 + 60) = 150
Thus we have two equations and two unknowns. Solving this we get y = 25

So, 25 people belong to exactly 2 clubs.

Test: Venn Diagrams- 1 - Question 4

207 people who attend “Bold Gym” in Kondapur take four types juices Apple, Orange, Pomegranate and Mango. There are a few people who do not take any of the juices. It is known that for every person in the Gym who takes atleast ‘N’ types of juices there are 2 persons who take atleast ‘N-1’ juices for N = 2, 3 and 4. If the number of people who take all four types of juices is equal to the number of people who do not take any juice at all, what is the number of people who take exactly 2 types of juices?

Detailed Solution for Test: Venn Diagrams- 1 - Question 4

Let the number of persons who do not take any juice and the number of persons who take all 4 types of juices be ‘x’.
As there are ‘x’ people who take atleast 4 types of juices there should be ‘2x’ people who take atleast 3 types of juices.
This means the number of people who take exactly 3 types of juices = 2x – x = x.
As there are ‘2x’ people who take atleast 3 types of juices there should be ‘4x’ people who take atleast 2 types of juices.
This means the number of people who take exactly 2 types of juices = 4x – x – x = 2x.
As there are ‘4x’ people who take atleast 2 types of juices there should be ‘8x’ people who take atleast 1 type of juices.
This means the number of people who take exactly 1 type of juices = 8x – 4x = 4x.
Thus the total number of people in the Gym = x + 4x + 2x + x + x = 9x.
9x = 207 => x = 23.
The number of people who take exactly 2 types of juices = 2x = 46.

Test: Venn Diagrams- 1 - Question 5

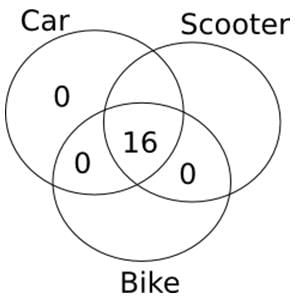
Out of 60 families living in a building, all those families which own a car own a scooter as well. No family has just a scooter and a bike. 16 families have both a car and a bike. Every family owns at least one type of vehicle and the number of families that own exactly one type of vehicle is more than the number of families that own more than one type of vehicle. What is the sum of the maximum and minimum number of families that own only a bike?

Detailed Solution for Test: Venn Diagrams- 1 - Question 5

From the information given in the question, the following Venn Diagram can be constructed:

So, in order to maximize the number of families that own only a bike, we can put the remaining 44 families in ‘only bike’ region.

Similarly, in order to minimize the number of families that own only a bike, we can put the remaining 44 families in ‘only scooter’ region.

So, the maximum number of families that own only a bike is 44 and the minimum number of families that own only a bike is 0.

So, sum = 44 + 0 = 44

Test: Venn Diagrams- 1 - Question 6

400 students were admitted to the 2018-19 MBA batch. 200 of them did not choose “Business Statistics”. 100 of them did not choose “International Management’. There were 80 students who did not choose any of the two subjects. Find the number of students who chose both Business Statistics and International Management.

Detailed Solution for Test: Venn Diagrams- 1 - Question 6

Number of students who chose Business statistics = 400 − 200 = 200

Number of students who chose International Management = 400 − 100 = 300

Number of students who chose at least one of the two subjects = 400 − 80 = 320

∴ Number of students who chose both the subjects = 200 + 300 − 320 = 500 − 320 = 180

Hence, option (b).

Test: Venn Diagrams- 1 - Question 7

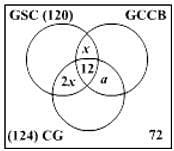
A premier B-school, which is in process of getting an AACSB accreditation, has 360 second year students. To incorporate sustainability into their curriculum, it has offered 3 new elective subjects in the second year namely Green Supply Chain, Global Climate Change & Business and Corporate Governance. Twelve students have taken all the three electives, and 120 students study Green Supply Chain. There are twice as many students who study Green Supply Chain and Corporate Governance but not Global Climate Change and Business, as those who study both Green Supply Chain and Global Climate Change & Business but not Corporate Governance, and 4 times as many who study all the three. 124 students study Corporate Governance. There are 72 students who could not muster up the courage to take up any of these subjects. The group of students who study both Green Supply Chain and Corporate Governance but not global Climate Change & Business is exactly the same as the group made up to the students who study both Global Climate Change & Business and Corporate Governance. How many students study Global Climate Change & Business only?

Detailed Solution for Test: Venn Diagrams- 1 - Question 7

The number of students who study each combination of subjects (based on the direct data) given is as shown below:

It is given that: (GSC and CG but not GCCB) = 4 times (all three electives)

∴ 2x = 4(12) i.e. x = 24

Also: (GSC and CG but not GCCB) = (all three electives) + (GCCB and CG but not GSC) 

∴ (GCCB and CG but not GSC) = 2x − 12 = 2(24) − 12 = 36

So, the figure becomes:

Now, CG only = 124 − (48 + 12 + 36) = 28 

∴ GCCB alone = 360 − 120 − 36 − 28 − 72 = 104

Hence, option (b).

Test: Venn Diagrams- 1 - Question 8

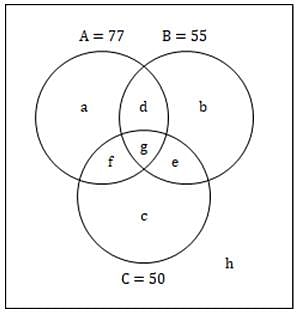
In an amusement park along with the entry pass a visitor gets two of the three available rides (A, B and C) free. On a particular day 77 opted for ride A, 55 opted for B and 50 opted for C; 25 visitors opted for both A and C, 22 opted for both A and B, while no visitor opted for both B and C. 40 visitors did not opt for ride A and B, or both. How many visited with the entry pass on that day?

Detailed Solution for Test: Venn Diagrams- 1 - Question 8

Let the Venn diagram be as shown in the figure,

No one can take all three rides, hence g = 0.

22 people take rides A and B, 
∴ d = 22

25 people take rides A and C, 
∴ f = 25

50 people take ride C, 
∴ c = 50 – 25 = 25.

40 people don’t take A or B or both,
∴ 40 = c + h
⇒ h = 40 – 25 = 15

∴ Total number of people visiting the park = (77 + 55 + 50 – 25 – 22) + 15 = 150.

Hence, option (d).

Test: Venn Diagrams- 1 - Question 9

290 students of MBA (International Business) in a reputed Business School have to study foreign language in Trimesters IV and V. Suppose the following information are given

(i) 120 students study Spanish
(ii) 100 students study Mandarin
(iii) At least 80 students, who study a foreign language, study neither Spanish nor Mandarin

Then the number of students who study Spanish but not Mandarin could be any number from

Detailed Solution for Test: Venn Diagrams- 1 - Question 9

Atleast 80 students study neither Spanish nor Mandarin.
Hence, maximum number of students who study atleast one language = 290 – 80 = 210

Minimum number of students who study both languages = 100 + 120 – 210 = 10

∴ Maximum number of students who study Spanish but not Mandarin = 120 – 10 = 110

Maximum number of students who study both languages = smaller value of 100 and 120 = 100

∴ Minimum number of students who study Spanish but not Mandarin = 120 – 100 = 20

Hence, the range could be any number from 20 to 110.

Hence, option (a).

Test: Venn Diagrams- 1 - Question 10

In a certain village, 22% of the families own agricultural land, 18% own a mobile phone and 1600 families own both agricultural land and a mobile phone. If 68% of the families neither own agricultural land nor a mobile phone, then the total number of families living in the village is:

Detailed Solution for Test: Venn Diagrams- 1 - Question 10

Let total number of families in the village be T
Number of families own agricultural land, n(A) = 0.22T

Number of families own mobile phone, n(M) = 0.18T

Number of families own both agricultural land and mobile phone, n(A ⋂ M) = 1600

Number of families own agricultural land or mobile phone, n(A ⋃ M) = T – 0.68T = 0.32T

∴ n(A ⋃ M) = n(A) + n(M) – n(A ⋂ M)

∴ n(A ⋂ M) = 0.08T

0.08T = 1600 ⇒ T = 20000

Hence, option (a).

197 videos|151 docs|200 tests
Information about Test: Venn Diagrams- 1 Page
In this test you can find the Exam questions for Test: Venn Diagrams- 1 solved & explained in the simplest way possible. Besides giving Questions and answers for Test: Venn Diagrams- 1, EduRev gives you an ample number of Online tests for practice
197 videos|151 docs|200 tests
Download as PDF

How to Prepare for UPSC

Read our guide to prepare for UPSC which is created by Toppers & the best Teachers
Download free EduRev App
Track your progress, build streaks, highlight & save important lessons and more!