Humanities/Arts Exam  >  Humanities/Arts Tests  >  Geography Class 12  >  Test: The World Population- Graph Based Type Questions - Humanities/Arts MCQ

Test: The World Population- Graph Based Type Questions - Humanities/Arts MCQ


Test Description

12 Questions MCQ Test Geography Class 12 - Test: The World Population- Graph Based Type Questions

Test: The World Population- Graph Based Type Questions for Humanities/Arts 2024 is part of Geography Class 12 preparation. The Test: The World Population- Graph Based Type Questions questions and answers have been prepared according to the Humanities/Arts exam syllabus.The Test: The World Population- Graph Based Type Questions MCQs are made for Humanities/Arts 2024 Exam. Find important definitions, questions, notes, meanings, examples, exercises, MCQs and online tests for Test: The World Population- Graph Based Type Questions below.
Solutions of Test: The World Population- Graph Based Type Questions questions in English are available as part of our Geography Class 12 for Humanities/Arts & Test: The World Population- Graph Based Type Questions solutions in Hindi for Geography Class 12 course. Download more important topics, notes, lectures and mock test series for Humanities/Arts Exam by signing up for free. Attempt Test: The World Population- Graph Based Type Questions | 12 questions in 24 minutes | Mock test for Humanities/Arts preparation | Free important questions MCQ to study Geography Class 12 for Humanities/Arts Exam | Download free PDF with solutions
Test: The World Population- Graph Based Type Questions - Question 1

Study the given graph carefully and answer the following questions:

Why is Brazil sparsely populated?

Detailed Solution for Test: The World Population- Graph Based Type Questions - Question 1
The north east of Brazil is very sparsely populated due to the climate of the area. The north east suffers from frequent droughts which means many people have moved out of the area in search of better jobs and prospects as well as a more equable climate.
Test: The World Population- Graph Based Type Questions - Question 2

Study the given graph carefully and answer the following questions:

What does the transition from high fluctuating stage to low fluctuating stage indicate?

Detailed Solution for Test: The World Population- Graph Based Type Questions - Question 2

Shift from Rural Agrarian economy to Urban Industrial economy

1 Crore+ students have signed up on EduRev. Have you? Download the App
Test: The World Population- Graph Based Type Questions - Question 3

Study the given graph carefully and answer the following questions:

What is the speciality of the period 1650 CE to present?

Detailed Solution for Test: The World Population- Graph Based Type Questions - Question 3
Technological revolutions is the speciality of the period 1650 CE to present.
Test: The World Population- Graph Based Type Questions - Question 4

Study the given graph carefully and answer the following questions:

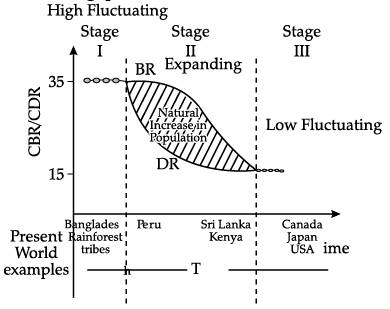
In which stage of Demographic Transition, population explosion took place:

Detailed Solution for Test: The World Population- Graph Based Type Questions - Question 4
A consequence of the decline in mortality in Stage Two is an increasingly rapid growth in population growth (a.k.a. "population explosion") as the gap between deaths and births grows wider and wider. Note that this growth is not due to an increase in fertility (or birth rates) but to a decline in deaths.
Test: The World Population- Graph Based Type Questions - Question 5

Study the given graph carefully and answer the following questions:

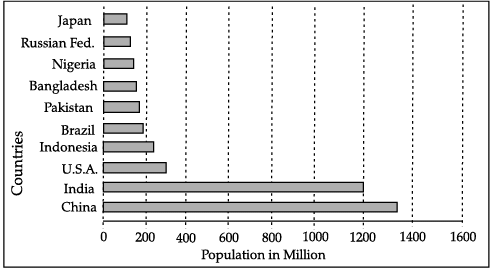
Identify the Asian country with the maximum population.

Detailed Solution for Test: The World Population- Graph Based Type Questions - Question 5
China is the Asian country with the maximum population.
Test: The World Population- Graph Based Type Questions - Question 6

Study the given graph carefully and answer the following questions:

Which of these periods closely represents the European explorations?

Detailed Solution for Test: The World Population- Graph Based Type Questions - Question 6
1520 CE to 1900 CE closely represents the European explorations.
Test: The World Population- Graph Based Type Questions - Question 7

Study the given graph carefully and answer the following questions:

How does the natural increase in population occur, as per the graph?

Detailed Solution for Test: The World Population- Graph Based Type Questions - Question 7
Birth Rate – Death Rate shows the natural increase in population occur, as per the graph.
Test: The World Population- Graph Based Type Questions - Question 8

Study the given graph carefully and answer the following questions:

Why is Japan’s population decreasing?

Detailed Solution for Test: The World Population- Graph Based Type Questions - Question 8
That gap between births and deaths has put Japan in a demographic squeeze. As the number of births goes down, there are fewer young people entering its work force. That means fewer people to replace retiring workers and support them as they age, a situation that poses a serious threat to Japan’s economic vitality and the security of its social safety net.
Test: The World Population- Graph Based Type Questions - Question 9

Study the given graph carefully and answer the following questions:

What was the approximate population of the world in 1600s?

Detailed Solution for Test: The World Population- Graph Based Type Questions - Question 9
In the past the population grew slowly: it took nearly seven centuries for the population to double from 0.25 billion (in the early 9th century) to 0.5 billion in the middle of the 16th century.
Test: The World Population- Graph Based Type Questions - Question 10

Study the given graph carefully and answer the following questions:

Why is Asia the most populous continent?

Detailed Solution for Test: The World Population- Graph Based Type Questions - Question 10
Asia has historically had a higher population density. One of the biggest reasons is that rice provides so much more calories per acre than wheat and barley. Especially before the introduction of maize and potatoes during the Columbian exchange, this was a huge reason for the high population density.
Test: The World Population- Graph Based Type Questions - Question 11

Study the given graph carefully and answer the following questions:

From the given graph, what condition can you infer about the developing countries?

Detailed Solution for Test: The World Population- Graph Based Type Questions - Question 11

High Birth Rate and Low death Rate condition can be infered about the developing countries

Test: The World Population- Graph Based Type Questions - Question 12

Study the given graph carefully and answer the following questions:

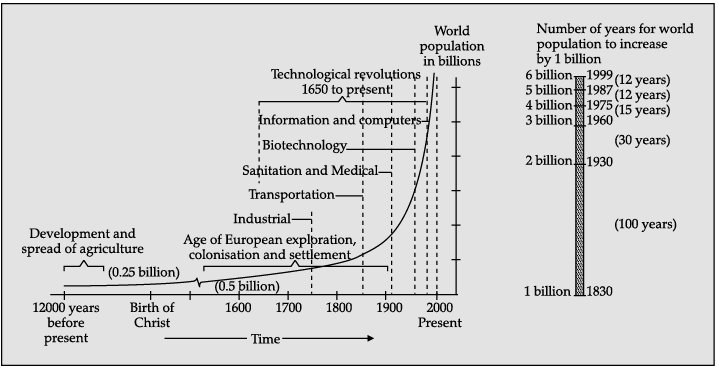
In how many years did world population increase from 4 billion to 5 billion?

Detailed Solution for Test: The World Population- Graph Based Type Questions - Question 12

It was another 123 years before it reached two billion in 1927, but it took only 33 years to reach three billion in 1960. Thereafter, the global population reached four billion in 1974, five billion in 1987, six billion in 1999 and, according to the United States Census Bureau, seven billion in March 2012.

50 videos|247 docs|43 tests
Information about Test: The World Population- Graph Based Type Questions Page
In this test you can find the Exam questions for Test: The World Population- Graph Based Type Questions solved & explained in the simplest way possible. Besides giving Questions and answers for Test: The World Population- Graph Based Type Questions, EduRev gives you an ample number of Online tests for practice

Top Courses for Humanities/Arts

50 videos|247 docs|43 tests
Download as PDF

Top Courses for Humanities/Arts