Commerce Exam  >  Commerce Tests  >  Mathematics (Maths) Class 11  >  Test: Statistics- 2 - Commerce MCQ

Test: Statistics- 2 - Commerce MCQ


Test Description

25 Questions MCQ Test Mathematics (Maths) Class 11 - Test: Statistics- 2

Test: Statistics- 2 for Commerce 2025 is part of Mathematics (Maths) Class 11 preparation. The Test: Statistics- 2 questions and answers have been prepared according to the Commerce exam syllabus.The Test: Statistics- 2 MCQs are made for Commerce 2025 Exam. Find important definitions, questions, notes, meanings, examples, exercises, MCQs and online tests for Test: Statistics- 2 below.
Solutions of Test: Statistics- 2 questions in English are available as part of our Mathematics (Maths) Class 11 for Commerce & Test: Statistics- 2 solutions in Hindi for Mathematics (Maths) Class 11 course. Download more important topics, notes, lectures and mock test series for Commerce Exam by signing up for free. Attempt Test: Statistics- 2 | 25 questions in 25 minutes | Mock test for Commerce preparation | Free important questions MCQ to study Mathematics (Maths) Class 11 for Commerce Exam | Download free PDF with solutions
Test: Statistics- 2 - Question 1

If the mean of the squares of first n natural numbers be 11, then n is equal to

Detailed Solution for Test: Statistics- 2 - Question 1

The mean of the squares of the first n natural numbers is given by:

The sum of the squares of the first n natural numbers is:

Thus, the mean is:

We are given that the mean is 11. Therefore:

Multiply through by 6:
(n+1)(2n+1)=66
Expand:
2n2  +3n+1=66
Simplify:
2n2+3n−65=0
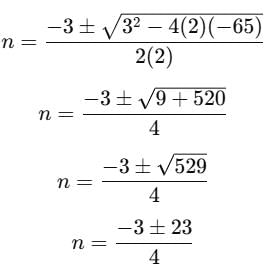
Solve this quadratic equation using the quadratic formula:

Here,  a=2, b=3, and  c=−65:

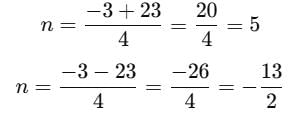
Calculate the two solutions:

Since n must be a positive integer, n=5.

Test: Statistics- 2 - Question 2

If the mean of the first n odd natural numbers be n itself, then n is equal to

Detailed Solution for Test: Statistics- 2 - Question 2

The first  n odd natural numbers are 1,3,5,…,(2n−1). The mean of these numbers is calculated as:

The sum of the first n odd natural numbers is:
Sum=n2
So, the mean becomes:

We are given that the mean is equal to n itself. This equality holds true for any natural number n.

Test: Statistics- 2 - Question 3

The mean of the first n terms of the A.P. (a + d) + (a + 3d) + (a + 5d) +………..is

Detailed Solution for Test: Statistics- 2 - Question 3

The given arithmetic progression (AP) is:
(a+d),(a+3d),(a+5d),…
This sequence has a common difference of 2d.
Step 1: General term
The n-th term of this AP is given by:
Tn =a+(2n−1)d
Step 2: Sum of the first n terms
The sum of the first n terms of an AP is:

Here: First term = a+d
Last term = Tn ​ =a+(2n−1)d

Simplify the terms:

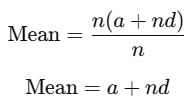
Step 3: Mean of the first n terms
The mean of the first n terms is:

Substitute Sn​:

Test: Statistics- 2 - Question 4

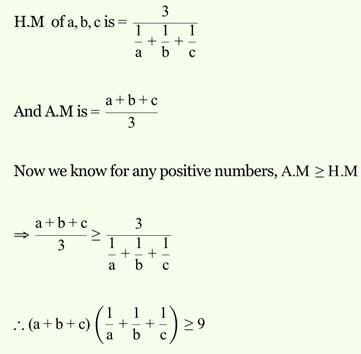
If a, b, c be any three positive numbers, then the least value of  (a + b + c) 

Detailed Solution for Test: Statistics- 2 - Question 4


Test: Statistics- 2 - Question 5

The median of the data 13,14,16,18,20,22 is

Detailed Solution for Test: Statistics- 2 - Question 5

To find the median, we first arrange the data in ascending order (already done here):
13,14,16,18,20,22
Step 1: Count the number of observations
The number of data points is n = 6 (even).
Step 2: Median for even n
For an even number of observations, the median is the average of the two middle values. The two middle values here are 16 and 18.

Test: Statistics- 2 - Question 6

If the two lines of regression are at right angles, then ρ(X,Y) is equal to

Detailed Solution for Test: Statistics- 2 - Question 6

If the two lines of regression are at right angles, it means that the product of their slopes is −1. This happens only when the correlation coefficient ρ(X,Y) is 0.
The correlation coefficient measures the linear relationship between two variables. Whe ρ(X,Y)=0, the two lines of regression are perpendicular, indicating no linear correlation.

Test: Statistics- 2 - Question 7

If COV(X,Y) = 0, then the two lines of the regression are

Detailed Solution for Test: Statistics- 2 - Question 7

If COV(X,Y)=0, it implies that the covariance between X and  Y is zero. This means that there is no linear relationship between the two variables. In such a case, the correlation coefficient  ρ(X,Y)=0, and the two lines of regression will be at right angles to each other.

Test: Statistics- 2 - Question 8

If the variance of the data is V, then its S.D. is

Detailed Solution for Test: Statistics- 2 - Question 8

If the variance of the data is denoted by V, then the standard deviation (S.D.) is the square root of the variance.
Mathematically,
S.D. = √V
The correct answer is: a) √V

Test: Statistics- 2 - Question 9

If the two lines of regression are y = 3x – 5 and y = 2x – 4 , then ρ(X,Y) is equal to

Detailed Solution for Test: Statistics- 2 - Question 9

To determine the correlation coefficient  ρ(X,Y) from the two regression lines, we use the property that the product of the slopes of the two regression lines is equal to  ρ 2 .
Given regression lines:
y=3x−5
Slope (m1 ​) = 3

y=2x−4
Slope ( m2​) = 2
Step 1: Check the product of slopes
The product of the slopes of the regression lines is:
m 1 ​ ⋅m 2 ​ =3⋅2=6
However, for the two regression lines, the product of their slopes must satisfy:
m1 ​ ⋅m2 ​ =ρ 2
Thus: ρ2 =6
Step 2: Conclusion
Since ρ2 cannot exceed 1, this configuration of regression lines is not possible. Hence, ρ(X,Y) is undefined for the given regression lines.

Test: Statistics- 2 - Question 10

If the median = (mode + 2 mean) μ, then μ is equal to

Detailed Solution for Test: Statistics- 2 - Question 10

We are given the relationship:
Median=(Mode+2⋅Mean)μ
Step 1: Recall the empirical relationship
The empirical relationship between the mode, mean, and median is:
Mode=3⋅Median−2⋅Mean
Step 2: Substituting the given formula
Rearrange the given formula to solve for μ:

From the empirical relationship:
Mode+2⋅Mean=3⋅Median
Substituting into the equation for μ:

Test: Statistics- 2 - Question 11

If mean = (3 median – mode) x , then the value of x is

Detailed Solution for Test: Statistics- 2 - Question 11

We are given the relationship:
Mean=(3⋅Median−Mode)⋅x
Step 1: Recall the empirical relationship
The empirical relationship between the mean, median, and mode is:
Mode=3⋅Median−2⋅Mean
Step 2: Compare the given formula with the empirical relationship
Rewriting the empirical formula for the mean:

Compare this with the given formula:
Mean=(3⋅Median−Mode)⋅x
Equating the two expressions for the mean:

Step 3: Solve for x
Cancel 
3⋅Median−Mode (non-zero):

Test: Statistics- 2 - Question 12

Least square lines of regression give best possible estimates, when ρ(X,Y) is equal to

Detailed Solution for Test: Statistics- 2 - Question 12

The least square lines of regression provide the best possible estimates when the correlation coefficient  ρ(X,Y) is equal to 1 or -1. This is because a correlation of ρ=1 or  ρ=−1 indicates a perfect linear relationship between X and Y, meaning one variable can be predicted exactly from the other using the regression line.

Test: Statistics- 2 - Question 13

Quartile deviation is nearly equal to

Detailed Solution for Test: Statistics- 2 - Question 13

The quartile deviation (also called the semi-interquartile range) is approximately related to the standard deviation (σ) by the formula:

This relationship holds in cases where the data follows a normal distribution, as the quartile deviation is a measure of spread that focuses on the interquartile range.

Test: Statistics- 2 - Question 14

For a symmetrical distribution Q1 = 20 and Q3. = 40. The median of the data is

Detailed Solution for Test: Statistics- 2 - Question 14

In a symmetrical distribution, the median lies exactly halfway between the first quartile (Q1) and the third quartile (Q3). The formula for the median in such cases is:

Given:
Q1​=20andQ3​=40

Test: Statistics- 2 - Question 15

Which of the following is not a measure of dispersion ?

Detailed Solution for Test: Statistics- 2 - Question 15

A measure of dispersion quantifies the spread or variability of a dataset. Common measures of dispersion include:

  • Mean deviation: Measures the average distance of data points from the mean or median.
  • Variance: Measures the average squared deviation from the mean.
  • Range: Measures the difference between the maximum and minimum values.

The mean, however, is a measure of central tendency, not dispersion.

Test: Statistics- 2 - Question 16

The mean and S.D. of 1,2,3,4,5,6 is

Detailed Solution for Test: Statistics- 2 - Question 16

We are given the data: 1, 2, 3, 4, 5, 6

Step 1: Calculate the Mean

The formula for the mean is:

Mean = (Sum of all values) / (Number of values)

Substituting the values:

Mean = (1 + 2 + 3 + 4 + 5 + 6) / 6 = 21 / 6 = 7/2

Step 2: Calculate the Variance

The formula for variance is:

Variance = Σ(xi - Mean)² / n

1. Subtract the mean (7/2) from each value and square the result:

  • (1 - 7/2)² = (-5/2)² = 25/4
  • (2 - 7/2)² = (-3/2)² = 9/4
  • (3 - 7/2)² = (-1/2)² = 1/4
  • (4 - 7/2)² = (1/2)² = 1/4
  • (5 - 7/2)² = (3/2)² = 9/4
  • (6 - 7/2)² = (5/2)² = 25/4

2. Sum the squared values:

(25/4) + (9/4) + (1/4) + (1/4) + (9/4) + (25/4) = 70/4 = 35/2

3. Divide by n (6):

Variance = (35/2) / 6 = 35/12

Step 3: Calculate the Standard Deviation

The standard deviation is the square root of the variance:

Standard Deviation = √(35/12)

Final Answer

The mean is 7/2, and the standard deviation is √(35/12).

Correct option: (c) 7/2, √(35/12)

Test: Statistics- 2 - Question 17

The range of the following set of observations 2,3,5,9,8,7,6,5,7,4,3 is

Detailed Solution for Test: Statistics- 2 - Question 17

Step 1: Definition of Range
The range of a dataset is the difference between the maximum and minimum values.
Step 2: Identify Maximum and Minimum Values
From the given dataset:
2,3,5,9,8,7,6,5,7,4,3

  • Maximum value: 9
  • Minimum value: 2

Step 3: Calculate the Range
Range=Maximum−Minimum=9−2=7

Test: Statistics- 2 - Question 18

Which of the following, in case of a discrete data, is not equal to the median?

Detailed Solution for Test: Statistics- 2 - Question 18

The median is the middle value of a dataset when arranged in ascending order. It is also represented as:

  • The 5th decile (because the median divides the data into two equal parts, which is the 5th decile in the decile system).
  • The 2nd quartile (as quartiles divide the data into four equal parts, and the median is at the 2nd quartile).
  • The 50th percentile (since percentiles divide the data into 100 equal parts, and the median corresponds to the 50th percentile).

The lower quartile (Q1) is the first quartile, representing the 25th percentile, and is not equal to the median.

Test: Statistics- 2 - Question 19

Mean deviation from the mean for the observations – 1, 0 ,4 is

Detailed Solution for Test: Statistics- 2 - Question 19

To calculate the mean deviation from the mean, follow these steps:
Step 1: Find the Mean
The observations are: 
−1,0,4.
The mean (xˉ ) is calculated as:

Step 2: Calculate the Absolute Deviations
Find the absolute differences between each observation and the mean:
∣−1−1∣=2,∣0−1∣=1,∣4−1∣=3
Step 3: Find the Mean Deviation
The mean deviation from the mean is:

Test: Statistics- 2 - Question 20

The mean of 50 observations is 36, if two observations are 30 and 42 are deleted , then the mean of the remaining observations is

Detailed Solution for Test: Statistics- 2 - Question 20

Step 1: Calculate the total sum of the observations
The mean of 50 observations is 36. Therefore, the total sum of the 50 observations is: Total Sum = Mean × Number of Observations
Total Sum=Mean×Number of Observations
Total Sum = 36 × 50 = 1800 Total Sum=36×50=1800
Step 2: Subtract the deleted observations
Two observations, 30 and 42, are deleted. The sum of these two observations is: Sum of deleted observations = 30 + 42 = 72
Sum of deleted observations=30+42=72
The new total sum of the remaining observations is:
New Total Sum = 1800 − 72 = 1728 New Total Sum=1800−72=1728
Step 3: Calculate the mean of the remaining observations
The number of remaining observations is:
50 − 2 = 48 50−2=48
The new mean is:
50−2=48
The new mean is:

Test: Statistics- 2 - Question 21

For a bivariate frequency distribution byx > 1, then byx is

Detailed Solution for Test: Statistics- 2 - Question 21

The regression coefficient b yx ​ is defined as the change in Y per unit change in X. It is related to the correlation coefficient ρ(X,Y) and the regression coefficient b xy ​ through the relationship:
byx​⋅bxy​=ρ2
Where ρ is the correlation coefficient, and ρ2 lies between 0 and 1.
Key Consideration: If  byx ​ >1, it means that the slope of the regression line predicting Y from X is greater than 1. However, b yx ​ can still be positive or negative depending on the direction of the relationship.
The condition  b yx ​ >1 implies a steeper slope of the regression line for Y on X. It does not necessarily indicate negativity or positivity, as it depends on the data.

Test: Statistics- 2 - Question 22

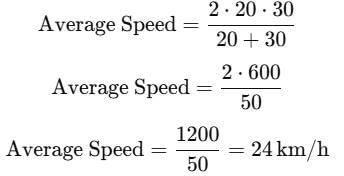
A man travels at a speed of 20 km/hour and then return at a speed of 30 km/hour. His average speed of the whole journey is

Detailed Solution for Test: Statistics- 2 - Question 22

To find the average speed of the whole journey, use the formula for the average speed in a round trip:

Where: v1 ​ is the speed for the first part of the journey ( 20 km/h 20km/h),
v 2 ​ is the speed for the return journey ( 30 km/h 30km/h).
Step 1: Substitute the values

Test: Statistics- 2 - Question 23

In a group of students, mean weight of boys is 80 kg and mean weight of girls is 50kg.If the mean weight of all the students taken together is 60kg, then the ratio of the number of boys to that of the girls is

Detailed Solution for Test: Statistics- 2 - Question 23

To solve this, let the number of boys be b and the number of girls be g.
Step 1: Use the formula for the combined mean
The formula for the mean of a combined group is:

Given: Mean weight of boys =  80kg,
Mean weight of girls =  50kg,
Combined mean = 60kg.
The total weight of boys is 80b, and the total weight of girls is  50g. The total number of students is  b+g. Substituting these into the formula:

Step 2: Solve for the ratio b/g
Multiply through by  b+g to eliminate the denominator:
60(b+g)=80b+50g
Expand and simplify:
60b+60g=80b+50g
60g−50g=80b−60b
10g=20b

Step 3: Conclusion
The ratio of the number of boys to the number of girls is:
1:2

Test: Statistics- 2 - Question 24

If the mean of 3,4,x,7,10, is 6, then the value of x is

Detailed Solution for Test: Statistics- 2 - Question 24

To find the value of x, we use the formula for the mean:

Step 1: Write the equation for the mean
Given:

  • Observations: 3,4,x,7,10
  • Mean: 6

Substitute into the formula:

Step 2: Simplify the equation

Multiply through by 5:
30=24+x
Solve for x:
x=30−24=6

Test: Statistics- 2 - Question 25

For a normal distribution, we have

Detailed Solution for Test: Statistics- 2 - Question 25

For a normal distribution, the following property holds:
Mean=Median=Mode
This is because a normal distribution is symmetric about its center, and the mean, median, and mode all lie at the same central point.

75 videos|238 docs|91 tests
Information about Test: Statistics- 2 Page
In this test you can find the Exam questions for Test: Statistics- 2 solved & explained in the simplest way possible. Besides giving Questions and answers for Test: Statistics- 2, EduRev gives you an ample number of Online tests for practice
75 videos|238 docs|91 tests
Download as PDF