Multiple Choice Questions (MCQs): Graphical Representation of Motion - NEET MCQ
10 Questions MCQ Test Physics Class 11 - Multiple Choice Questions (MCQs): Graphical Representation of Motion
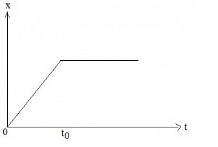
Figure shows the displacement – time graph of a particle moving along X – axis.

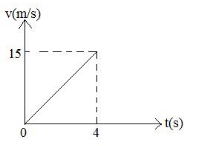
The graph represents the velocity time for the first 4 seconds of motion. The distance covered is

A person goes from his home to his office taking one hour. There he works for 2 hours and then in half hour reaches home back. A representative displacement-time graph
Speed time graph of a particle moving along a fixed direction is shown in the figure below. The average speed of the particle over the interval: t = 0 s to 10 s.
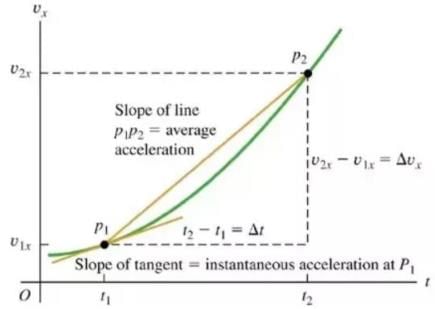
The acceleration at any instant is the slope of the tangent of the ________ curve at that instant:
Slope of displacement time graph or x-t graph gives us the particles’ ____________.
Two balls of equal mass and of Perfectly inelastic material are lying on the floor. One of the balls with velocity V is made to strike the second ball. Both the balls after impact will move with a velocity
On velocity-time graph when two curves coincide, the objects will have
Which position – time graph represents the motion of two objects that will never meet?
Linear inequalities are graphically represented on Cartesian plane by a
|
97 videos|379 docs|103 tests
|


