SSC CGL Previous Year Questions: Data Interpretation - 1 - SSC CGL MCQ
20 Questions MCQ Test SSC CGL Previous Year Papers - SSC CGL Previous Year Questions: Data Interpretation - 1
DIRECTIONS: In the following questions, select the related word pair from the given alternatives.
The Table shows the number of cars sold by three showrooms over a period of six years.
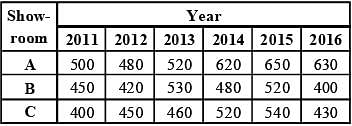 (SSC CGL-2018)
Q. If the total number of cars sold by all three showrooms over the years is represented as a pie-chart, what is the central angle of the sector representing the total number of cars sold in the year 2013 (to the nearest whole number)?
The Table shows the number of cars sold by three showrooms over a period of six years.
 (SSC CGL-2018)
DIRECTIONS: In the following questions, select the related word pair from the given alternatives.
The Table shows the number of cars sold by three showrooms over a period of six years.
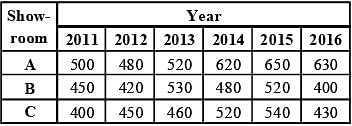 (SSC CGL-2018)
Q. What is the ratio of the total cars sold by showroom B during the years 2014 and 2016 and the total cars sold by showroom C during 2015 and 2016?
The Table shows the number of cars sold by three showrooms over a period of six years.
 (SSC CGL-2018)
DIRECTIONS: In the following questions, select the related word pair from the given alternatives.
The Table shows the number of cars sold by three showrooms over a period of six years.
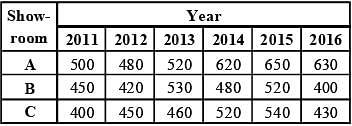 (SSC CGL-2018)
Q. By what percent did the total number of cars sold by all three showrooms decrease during the year 2016, as compared to that in the year 2015 (nearest to one decimal place)?
The Table shows the number of cars sold by three showrooms over a period of six years.
 (SSC CGL-2018)
DIRECTIONS: In the following questions, select the related word pair from the given alternatives.
The Table shows the number of cars sold by three showrooms over a period of six years.
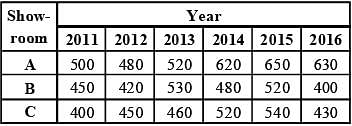 (SSC CGL-2018)
Q. What is the average number of cars sold by showroom A over the given six years (nearest to one decimal place)?
DIRECTIONS: In the following questions, select the related word pair from the given alternatives.
The Table shows the number of cars sold by three showrooms over a period of six years.
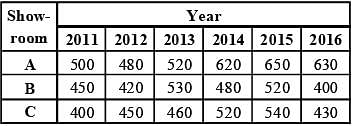 (SSC CGL-2018)
Q. The Bar graph given below presents the number of shoes manufactured by a company on the different days of a week.
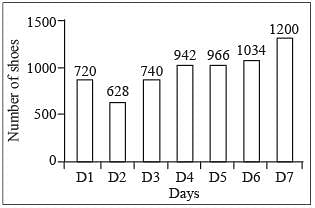
What is the total number of shoes manufactured by the company on all seven days together?
DIRECTIONS: In the following questions, select the related word pair from the given alternatives.
The Table shows the number of cars sold by three showrooms over a period of six years.
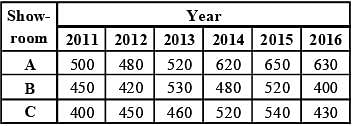 (SSC CGL-2018)
Q. The Bar graph given below presents the number of shoes manufactured by a company on the different days of a week.
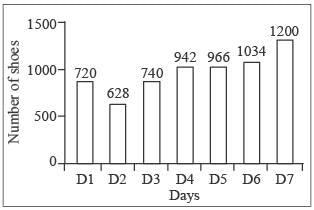
The number of shoes manufactured on D5 is how much more than the average number of shoes manufactured per day?
DIRECTIONS: In the following questions, select the related word pair from the given alternatives.
The Table shows the number of cars sold by three showrooms over a period of six years.
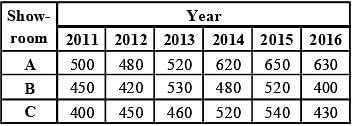 (SSC CGL-2018)
Q. The Bar graph given below presents the number of shoes manufactured by a company on the different days of a week.
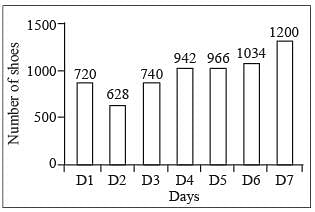
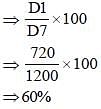
The number of shoes manufactured on D1 is what percentage of shoes manufactured on D7?
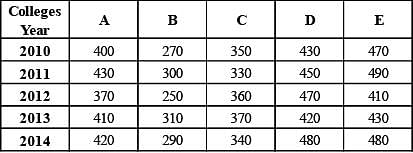
DIRECTIONS: The table below shows the number of students enrolled in five colleges over the five years (2010 to 2014).
 (SSC CGL-2018)
Q. In the year 2014, what percent of students were enrolled in college C (correct to one decimal place)?
DIRECTIONS: The table below shows the number of students enrolled in five colleges over the five years (2010 to 2014).
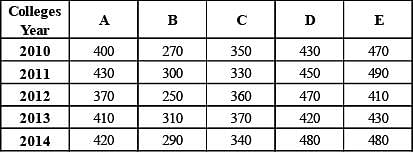 (SSC CGL-2018)
Q. What is the ratio of the total students enrolled in colleges A and B in the year 2012 to the total students enrolled in colleges D and E in the year 2013?
DIRECTIONS: The table below shows the number of students enrolled in five colleges over the five years (2010 to 2014).
 (SSC CGL-2018)
Q. The number of students studyin g in college E in the year 2013 is approximately what percent of the number of students studying in colleges B, C and D taken together in the year 2013 (nearest to one decimal place)?
DIRECTIONS: The table below shows the number of students enrolled in five colleges over the five years (2010 to 2014).
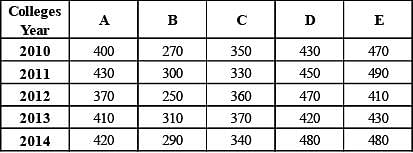 (SSC CGL-2018)
Q. What is the average number of students studying in college D over the given years?
The given Bar Graph presents the data of annual income (A) and annual expenditure (B) of an IT officer in a multinational company during the years 2012 to 2016.
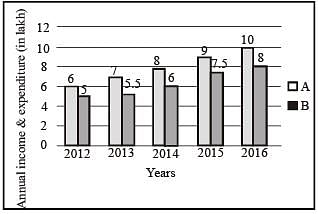
What is the ratio between the ratios of Savings to Expenditure, respectively for the periods 2012-13 and 2015-16? (SSC CHSL-2018)
The given Bar Graph presents the data of annual income (A) and annual expenditure (B) of an IT officer in a multinational company during the years 2012 to 2016.
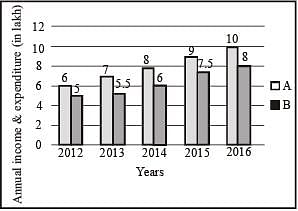
What is the percentage of his total savings with reference to his total income for the period 2012-15? (SSC CHSL-2018)
The given Bar Graph presents the data of annual income (A) and annual expenditure (B) of an IT officer in a multi-national company during the years 2012 to 2016.
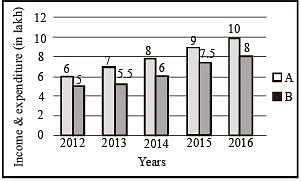
What was his average monthly savings (in ₹) in 2015 and 2016, taken together (correct to two decimal places)? (SSC CHSL-2018)
The given Bar Graph presents the data of annual income (A) and annual expenditure (B) of an IT officer in a multinational company during the years 2012 to 2016.
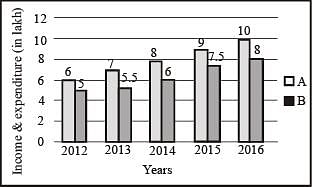
For which pair of years, the ratio of savings to expenditure is equal? (SSC CHSL-2018)
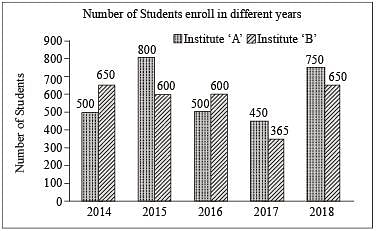
In the given bar graph, the number of students enrolled in institute B in the year 2016 is what percentage of students enrolled in institute A in 2016? (SSC Sub. Ins. 2018)
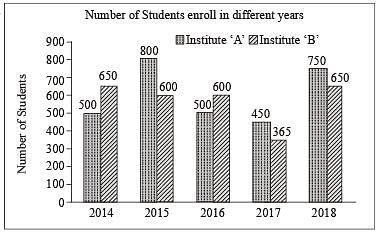
In the given bar graph, the percentage decrease in the number of students in Institute A in 2016 is what percent of students in 2015. (SSC Sub. Ins. 2018)
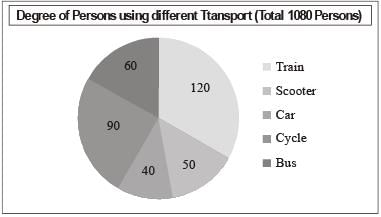
In the given pie-chart, what is the ratio of the total number of persons using train and car together to the total number of persons using other modes of transport to reach their workplace? (SSC Sub. Ins. 2018)
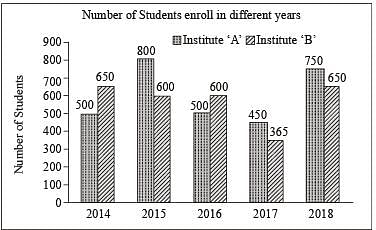
In the given bar graph, what is the ratio of students of A and B in the combine strength from 2016 to 2018? (SSC Sub. Ins. 2018)
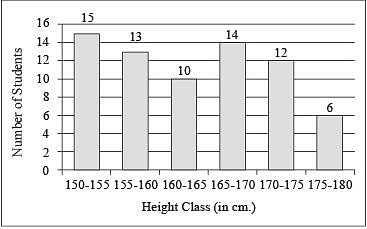
In the given histogram, what is the percentage of students whose height is in the class interval 165-170? (SSC Sub. Ins. 2018)
|
316 docs|268 tests
|


