SSC CGL Exam  >  SSC CGL Tests  >  SSC CGL Previous Year Papers  >  SSC CGL Previous Year Questions: Data Interpretation - 4 - SSC CGL MCQ

SSC CGL Previous Year Questions: Data Interpretation - 4 - SSC CGL MCQ


Test Description

30 Questions MCQ Test SSC CGL Previous Year Papers - SSC CGL Previous Year Questions: Data Interpretation - 4

SSC CGL Previous Year Questions: Data Interpretation - 4 for SSC CGL 2024 is part of SSC CGL Previous Year Papers preparation. The SSC CGL Previous Year Questions: Data Interpretation - 4 questions and answers have been prepared according to the SSC CGL exam syllabus.The SSC CGL Previous Year Questions: Data Interpretation - 4 MCQs are made for SSC CGL 2024 Exam. Find important definitions, questions, notes, meanings, examples, exercises, MCQs and online tests for SSC CGL Previous Year Questions: Data Interpretation - 4 below.
Solutions of SSC CGL Previous Year Questions: Data Interpretation - 4 questions in English are available as part of our SSC CGL Previous Year Papers for SSC CGL & SSC CGL Previous Year Questions: Data Interpretation - 4 solutions in Hindi for SSC CGL Previous Year Papers course. Download more important topics, notes, lectures and mock test series for SSC CGL Exam by signing up for free. Attempt SSC CGL Previous Year Questions: Data Interpretation - 4 | 40 questions in 40 minutes | Mock test for SSC CGL preparation | Free important questions MCQ to study SSC CGL Previous Year Papers for SSC CGL Exam | Download free PDF with solutions
SSC CGL Previous Year Questions: Data Interpretation - 4 - Question 1

DIRECTIONS: Study the bar graph and answer the question.        (SSC Sub. Ins. 2015)

Q. The approximate percentage increase in quantity from 1997 to 1998 was : 

Detailed Solution for SSC CGL Previous Year Questions: Data Interpretation - 4 - Question 1

% increase in quantity from 1997 to 1998

None of the options are correct.
Correct answer is 15.4%.

SSC CGL Previous Year Questions: Data Interpretation - 4 - Question 2

DIRECTIONS: Study the bar graph and answer the question.        (SSC Sub. Ins. 2015)

Q. Percentage fall in value from 2000 to 2001 in :

Detailed Solution for SSC CGL Previous Year Questions: Data Interpretation - 4 - Question 2

% age fall in value from 2000 to 2001

None of the options are correct
Correct answer is 76%.

1 Crore+ students have signed up on EduRev. Have you? Download the App
SSC CGL Previous Year Questions: Data Interpretation - 4 - Question 3

DIRECTIONS: Study the bar graph and answer the question.        (SSC Sub. Ins. 2015)

Q. The difference between the bags exported in 1999 and 2000 was. 

Detailed Solution for SSC CGL Previous Year Questions: Data Interpretation - 4 - Question 3

Difference between the bags exported in 1999 and 2000
= 200 – 100 = 100 lakh = 100,00,000

SSC CGL Previous Year Questions: Data Interpretation - 4 - Question 4

DIRECTIONS: Study the bar graph and answer the question.        (SSC Sub. Ins. 2015)

Q. Value per bag was minimum in the year: 

Detailed Solution for SSC CGL Previous Year Questions: Data Interpretation - 4 - Question 4

It is clear from bar graph Value per bag is minimum in 1996.

SSC CGL Previous Year Questions: Data Interpretation - 4 - Question 5

DIRECTIONS: Study the following graph which shows income and expenditure of a company over the years 2005-2009 and answer questions.        (SSC CGL 1st Sit. 2014)

Q. The difference in profit (₹ in crores) of the company during 2006 and 2007 is 

Detailed Solution for SSC CGL Previous Year Questions: Data Interpretation - 4 - Question 5

Profit during 2006 = (60 – 35) = 25
Profit during 2007 = (50 – 40) = 10
Difference = 25 – 10 = 15

SSC CGL Previous Year Questions: Data Interpretation - 4 - Question 6

DIRECTIONS: Study the following graph which shows income and expenditure of a company over the years 2005-2009 and answer questions.        (SSC CGL 1st Sit. 2014)

Q. In how many years was the income of the company less than the average income of the given years? 

Detailed Solution for SSC CGL Previous Year Questions: Data Interpretation - 4 - Question 6

Average Income = 
Income during 2005 and 2007 is less than average.

SSC CGL Previous Year Questions: Data Interpretation - 4 - Question 7

DIRECTIONS: Study the following graph which shows income and expenditure of a company over the years 2005-2009 and answer questions.        (SSC CGL 1st Sit. 2014)

Q. The percentage increase in expenditure of the company from 2007 to 2008 is 

Detailed Solution for SSC CGL Previous Year Questions: Data Interpretation - 4 - Question 7

Required % = 

SSC CGL Previous Year Questions: Data Interpretation - 4 - Question 8

DIRECTIONS: Study the following graph which shows income and expenditure of a company over the years 2005-2009 and answer questions.        (SSC CGL 1st Sit. 2014)
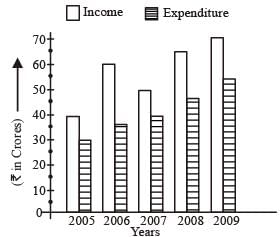
Q. Profit of the company was maximum in the year 

Detailed Solution for SSC CGL Previous Year Questions: Data Interpretation - 4 - Question 8

It is clear from the graph.

SSC CGL Previous Year Questions: Data Interpretation - 4 - Question 9

DIRECTIONS: Study the following table and answer question.      (SSC CGL 1st Sit. 2014)
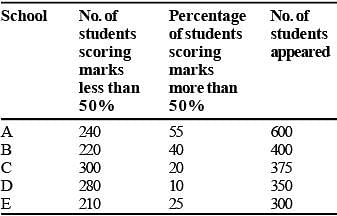
Q. The ratio of the total number of students scoring marks less than 50% to that of scoring marks exactly 50% is

Detailed Solution for SSC CGL Previous Year Questions: Data Interpretation - 4 - Question 9

Number of students scoring less than 50%
= (240 + 220 + 300 + 280 + 210) = 1250
Number of student scoring exact 50%
= (30 + 20 + 0 + 35 + 15) = 100
Ratio = 1250 : 100 = 25 : 2

SSC CGL Previous Year Questions: Data Interpretation - 4 - Question 10

DIRECTIONS: Study the following table and answer question.      (SSC CGL 1st Sit. 2014)
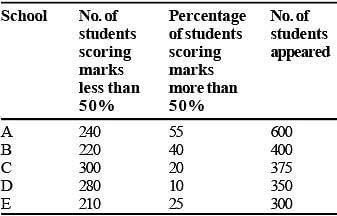
Q. Which school has the highest number of students scoring exactly 50% marks?

Detailed Solution for SSC CGL Previous Year Questions: Data Interpretation - 4 - Question 10

To answer this question, we need to analyze the given table, which is not provided in the question. However, based on the given options, the answer would be one of the four schools mentioned (A, B, D, or E).
To determine the correct answer, follow these steps:
1. Examine the table: Look for the column or row that indicates the number of students scoring exactly 50% marks in each school.
2. Compare the numbers: Compare the number of students scoring exactly 50% marks in each school to find the highest count.
3. Select the correct option: Choose the option that corresponds to the school with the highest number of students scoring exactly 50% marks.
Since the table is not provided, the correct answer cannot be determined. Please provide the table for a more accurate response.

SSC CGL Previous Year Questions: Data Interpretation - 4 - Question 11

DIRECTIONS: Study the following table and answer question.      (SSC CGL 1st Sit. 2014)
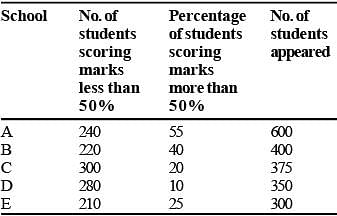
Q. The total number of students scoring 50% or more marks is

Detailed Solution for SSC CGL Previous Year Questions: Data Interpretation - 4 - Question 11

Number of students scoring 50% or more marks = (600 – 240) + (400 – 220) + (375 – 300) + (350 – 280) +
(300 – 210)
= 360 + 180 + 75 + 70 + 90 = 775

SSC CGL Previous Year Questions: Data Interpretation - 4 - Question 12

DIRECTIONS: The diagram shows the age distribution of the patients admitted to a hospital in a particular day. Study the diagram and answer.        (SSC CHSL 2014)

Q. Number of patients of age between 55 years to 60 years, who got admitted to the hospital on that day is

Detailed Solution for SSC CGL Previous Year Questions: Data Interpretation - 4 - Question 12

By observing the graph, we can say that number of patient of age between 55 years to 60 years who got admitted to the hospital on that day is 4.

SSC CGL Previous Year Questions: Data Interpretation - 4 - Question 13

DIRECTIONS: The diagram shows the age distribution of the patients admitted to a hospital in a particular day. Study the diagram and answer.        (SSC CHSL 2014)

Q. Total number of patients of age more than 55 years, who got admitted to the hospital is

Detailed Solution for SSC CGL Previous Year Questions: Data Interpretation - 4 - Question 13

More than 55 years = 4 + 3 + 2 + 1 = 10

SSC CGL Previous Year Questions: Data Interpretation - 4 - Question 14

DIRECTIONS: The diagram shows the age distribution of the patients admitted to a hospital in a particular day. Study the diagram and answer.        (SSC CHSL 2014)

Q. Number of patients of age more than 40 years and less than 55 years, who got admitted to the hospital on that day is 

Detailed Solution for SSC CGL Previous Year Questions: Data Interpretation - 4 - Question 14

Number of patients of age more than 40 years and less than 55 years = 8 + 7 + 5 = 20.

SSC CGL Previous Year Questions: Data Interpretation - 4 - Question 15

DIRECTIONS: The diagram shows the age distribution of the patients admitted to a hospital in a particular day. Study the diagram and answer.        (SSC CHSL 2014)
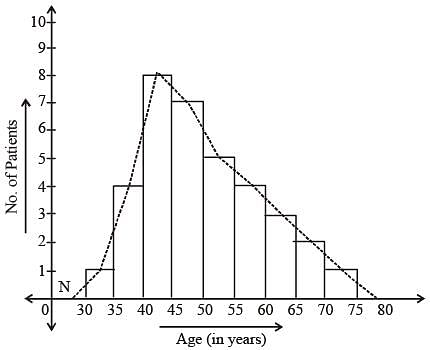
Q. Percentage of patients of  age less than 45 years, who got admitted to the hospital on that day is approximately equal to

Detailed Solution for SSC CGL Previous Year Questions: Data Interpretation - 4 - Question 15

Total patients = 35

SSC CGL Previous Year Questions: Data Interpretation - 4 - Question 16

DIRECTIONS: The diagram shows the age distribution of the patients admitted to a hospital in a particular day. Study the diagram and answer.        (SSC CHSL 2014)

Q. About 11% of the patients who  got admitted to the hospital on that particular day were of age

Detailed Solution for SSC CGL Previous Year Questions: Data Interpretation - 4 - Question 16

11% of 35 = (11/100) x 35 ≈ 3.8 ≈ 4
So, either between 35 years and 40 years or between 55 years and 60 years.

SSC CGL Previous Year Questions: Data Interpretation - 4 - Question 17

DIRECTIONS: Sales of Books (in thousand numbers) from Six Branches - B1, B2, B3, B4, B5 and B6 of a Publishing Company in 2000 and 2001. Study the graph and answer the question that follow:       (SSC CHSL 2014)

Q. Total sale of branches B1, B3 and B5 together for both the years (in thousand numbers) is 

Detailed Solution for SSC CGL Previous Year Questions: Data Interpretation - 4 - Question 17

Total sales of branches B1, B3 and B5.
= (80 + 105 + 95 + 110 + 75 + 95) = 560 thousand

SSC CGL Previous Year Questions: Data Interpretation - 4 - Question 18

DIRECTIONS: Sales of Books (in thousand numbers) from Six Branches - B1, B2, B3, B4, B5 and B6 of a Publishing Company in 2000 and 2001. Study the graph and answer the question that follow:       (SSC CHSL 2014)

Q. Find the ratio of the total sales of branch B2 for both years to the total sales of branch B4 for both years. 

Detailed Solution for SSC CGL Previous Year Questions: Data Interpretation - 4 - Question 18

Required ratio = 

SSC CGL Previous Year Questions: Data Interpretation - 4 - Question 19

DIRECTIONS: Sales of Books (in thousand numbers) from Six Branches - B1, B2, B3, B4, B5 and B6 of a Publishing Company in 2000 and 2001. Study the graph and answer the question that follow:       (SSC CHSL 2014)
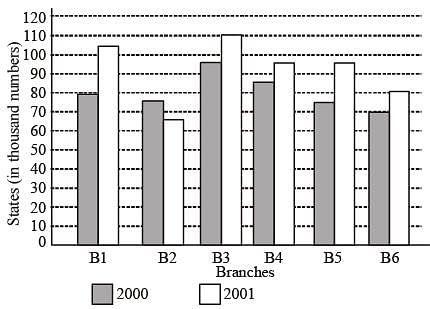
Q. Percentage of the average sale of branches B1, B2 and B3 in 2001 and the average sale of branches B1, B3 and B6 in 2000 

Detailed Solution for SSC CGL Previous Year Questions: Data Interpretation - 4 - Question 19

Average sale of B1, B2 and B3 in 2001.

Average sale of B1, B3 and B6 in 2000.

Required % = 

SSC CGL Previous Year Questions: Data Interpretation - 4 - Question 20

DIRECTIONS: Sales of Books (in thousand numbers) from Six Branches - B1, B2, B3, B4, B5 and B6 of a Publishing Company in 2000 and 2001. Study the graph and answer the question that follow:       (SSC CHSL 2014)

Q. Find the percentage increase in the sales of books of branch B3 in the year 2001 than the branch B2. 

Detailed Solution for SSC CGL Previous Year Questions: Data Interpretation - 4 - Question 20

Sales of books B3 in 2001 = 110 thousand
Sales of books B2 in 2001 = 65 thousand

SSC CGL Previous Year Questions: Data Interpretation - 4 - Question 21

DIRECTIONS: The bar chart representing the number of first year B.Com. students of St. Xavier's College using different companies' smart phones. Study bar chart and answer the question that follow:

The bar chart representing the no. of students using different smart phones.        (SSC Sub. Ins. 2014)

Q. The ratio of the number of boys to the number of girls using the smart phones of Samsung and Sony together is

Detailed Solution for SSC CGL Previous Year Questions: Data Interpretation - 4 - Question 21

Required ratio = (100 + 160) : (180 + 60) = 260 : 240 = 13 : 12

SSC CGL Previous Year Questions: Data Interpretation - 4 - Question 22

DIRECTIONS: The bar chart representing the number of first year B.Com. students of St. Xavier's College using different companies' smart phones. Study bar chart and answer the question that follow:
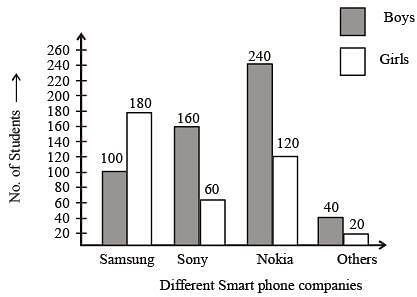
The bar chart representing the no. of students using different smart phones.        (SSC Sub. Ins. 2014)

Q. What percentage of boys are using the smart phones of Samsung ? 

Detailed Solution for SSC CGL Previous Year Questions: Data Interpretation - 4 - Question 22

Required % = 

SSC CGL Previous Year Questions: Data Interpretation - 4 - Question 23

DIRECTIONS: The bar chart representing the number of first year B.Com. students of St. Xavier's College using different companies' smart phones. Study bar chart and answer the question that follow:

The bar chart representing the no. of students using different smart phones.        (SSC Sub. Ins. 2014)

Q. What percentage of girls are using the smart phones of Nokia? 

Detailed Solution for SSC CGL Previous Year Questions: Data Interpretation - 4 - Question 23

Required % = 

SSC CGL Previous Year Questions: Data Interpretation - 4 - Question 24

DIRECTIONS: The bar chart representing the number of first year B.Com. students of St. Xavier's College using different companies' smart phones. Study bar chart and answer the question that follow:

The bar chart representing the no. of students using different smart phones.        (SSC Sub. Ins. 2014)

Q. The difference between the total number of students using smart phones of Samsung combined together and the total number of students using smart phone of Sony taken together is

Detailed Solution for SSC CGL Previous Year Questions: Data Interpretation - 4 - Question 24

Total students using Samsung = 100 + 180 = 280
Total students using Sony = 160 + 60 = 220
Difference = 280 – 220 = 60

SSC CGL Previous Year Questions: Data Interpretation - 4 - Question 25

DIRECTIONS: The bar chart representing the number of first year B.Com. students of St. Xavier's College using different companies' smart phones. Study bar chart and answer the question that follow:

The bar chart representing the no. of students using different smart phones.        (SSC Sub. Ins. 2014)

Q. Find the difference between the average sale of branches B5 and B6 in 2000 and 2001.

Detailed Solution for SSC CGL Previous Year Questions: Data Interpretation - 4 - Question 25

Sale of branch B5 in 2000 = 75
Sale of branch B6 in 2000 = 70
Average sale = 
and
Sale of branch B5 in 2001 = 95
Sale of branch B6 in 2001 = 80
Average sale = 
Hence, Difference = 87.5 – 72.5 = 15.

SSC CGL Previous Year Questions: Data Interpretation - 4 - Question 26

DIRECTIONS: The following pie-chart shows the monthly expenditure of a family on food, house rent, clothing, education, fuel and miscellaneous. Study the pie-chart and answer questions.

Q. If the expenditure for food is ₹9000, then the expenditure for education is         (SSC Sub. Ins. 2014)

Detailed Solution for SSC CGL Previous Year Questions: Data Interpretation - 4 - Question 26

Expenditure for education = 

SSC CGL Previous Year Questions: Data Interpretation - 4 - Question 27

DIRECTIONS: The following pie-chart shows the monthly expenditure of a family on food, house rent, clothing, education, fuel and miscellaneous. Study the pie-chart and answer questions.

Q. The central angle of the sector for the expenditure on fuel (in degrees) is       (SSC Sub. Ins. 2014)

Detailed Solution for SSC CGL Previous Year Questions: Data Interpretation - 4 - Question 27

Central angle of the sector for the expenditure on fuel = (360/100)x15 = 54º

SSC CGL Previous Year Questions: Data Interpretation - 4 - Question 28

DIRECTIONS: The following pie-chart shows the monthly expenditure of a family on food, house rent, clothing, education, fuel and miscellaneous. Study the pie-chart and answer questions.

Q. If the expenditure on fuel is ₹3000, then the total expenditure excluding expenditure on house rent and education is        (SSC Sub. Ins. 2014)

Detailed Solution for SSC CGL Previous Year Questions: Data Interpretation - 4 - Question 28

Expenditure excluding rent and education 
= 200 × 62
= ₹12400

SSC CGL Previous Year Questions: Data Interpretation - 4 - Question 29

DIRECTIONS: The following pie-chart shows the monthly expenditure of a family on food, house rent, clothing, education, fuel and miscellaneous. Study the pie-chart and answer questions.
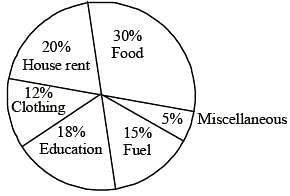
Q. If the percentage of expenditure on food is x% of the total percentage of expenditure on clothing, education and fuel, then x equals       (SSC Sub. Ins. 2014)

Detailed Solution for SSC CGL Previous Year Questions: Data Interpretation - 4 - Question 29

30 = x% of (12 + 18 +15)

SSC CGL Previous Year Questions: Data Interpretation - 4 - Question 30

DIRECTIONS: The following pie-chart shows the monthly expenditure of a family on food, house rent, clothing, education, fuel and miscellaneous. Study the pie-chart and answer questions.

Q. Total percentage of expenditure on house rent, clothing and fuel is greater than the percentage of expenditure on food by          (SSC Sub. Ins. 2014) 

Detailed Solution for SSC CGL Previous Year Questions: Data Interpretation - 4 - Question 30

Required difference = (20 + 12 + 15) – 30
= 47 – 30
= 17%

View more questions
191 docs|268 tests
Information about SSC CGL Previous Year Questions: Data Interpretation - 4 Page
In this test you can find the Exam questions for SSC CGL Previous Year Questions: Data Interpretation - 4 solved & explained in the simplest way possible. Besides giving Questions and answers for SSC CGL Previous Year Questions: Data Interpretation - 4, EduRev gives you an ample number of Online tests for practice

Up next

Download as PDF

Up next