Practice Test: Table Charts - 2 - Bank Exams MCQ
5 Questions MCQ Test - Practice Test: Table Charts - 2

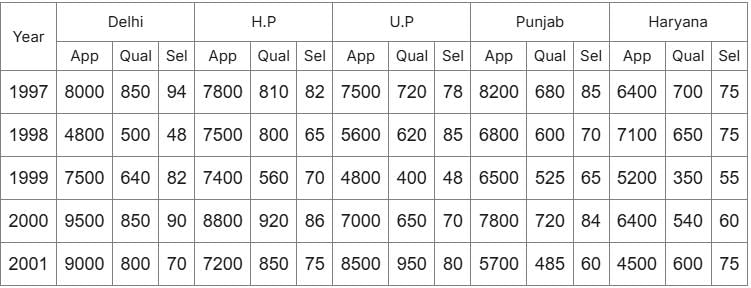
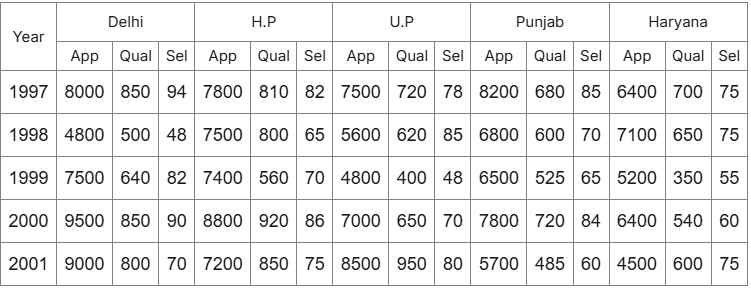
Study the following table and answer the questions based on it.
Number of Candidates Appeared, Qualified and Selected in a Competitive Examination from Five States Delhi, H.P, U.P, Punjab and Haryana Over the Years 1994 to 1998
Q.For which state the average number of candidates selected over the years is the maximum?
Study the following table and answer the questions based on it.
Number of Candidates Appeared, Qualified and Selected in a Competitive Examination from Five States Delhi, H.P, U.P, Punjab and Haryana Over the Years 1994 to 1998

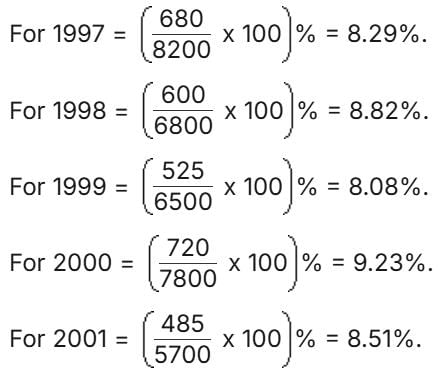
Q.The percentage of candidates qualified from Punjab over those appeared from Punjab is highest in the year?

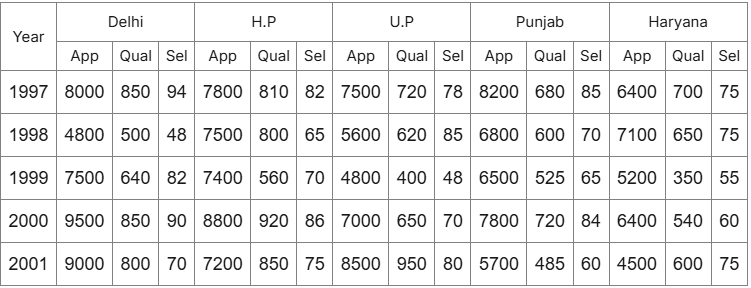
Study the following table and answer the questions based on it.
Number of Candidates Appeared, Qualified and Selected in a Competitive Examination from Five States Delhi, H.P, U.P, Punjab, and Haryana Over the Years 1994 to 1998
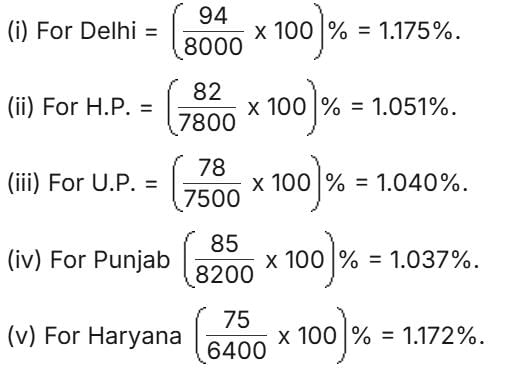
Q. Which State/UT had the lowest percentage of selected candidates in 1997 with respect to appearing candidates?
Study the following table and answer the questions.
Number of Candidates Appeared, Qualified and Selected in a Competitive Examination from Five States Delhi, H.P, U.P, Punjab and Haryana Over the Years 1994 to 1998.

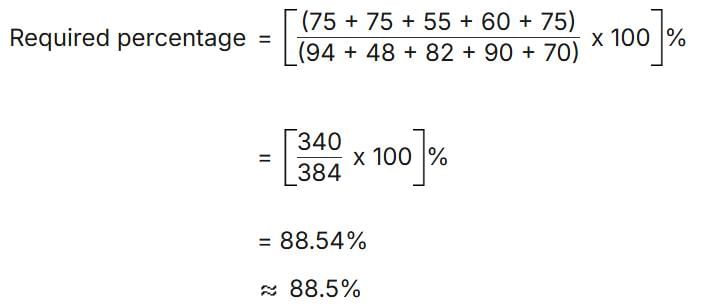
Q. The number of candidates selected from Haryana during the period under review is approximately what percent of the number selected from Delhi during this period?
Study the following table and answer the questions.
Number of Candidates Appeared, Qualified and Selected in a Competitive Examination from Five States Delhi, H.P, U.P, Punjab and Haryana Over the Years 1994 to 1998
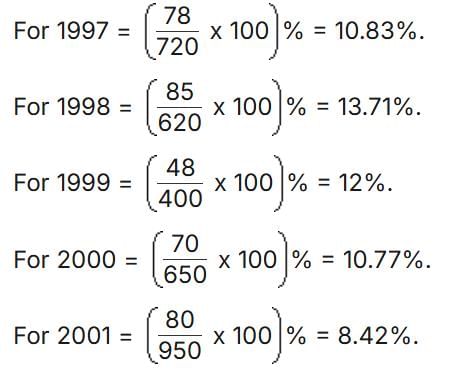
Q. In which of the given years the number of candidates appeared from State UP has maximum percentage of selected candidates?


Important Questions for Practice Test: Table Charts - 2
Practice Test: Table Charts - 2 MCQs with Answers
Online Tests for Practice Test: Table Charts - 2
|
© EduRev
|
Education Revolution
|


|


