Practice Test: Table Charts - 3 - UPSC MCQ
5 Questions MCQ Test CSAT Preparation - Practice Test: Table Charts - 3

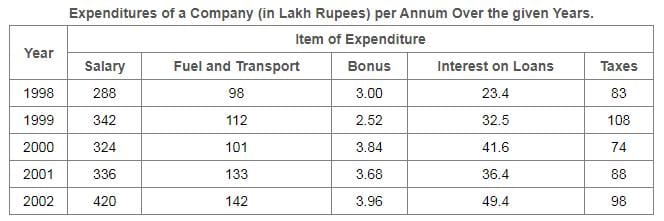
Study the following table and answer the questions based on it.
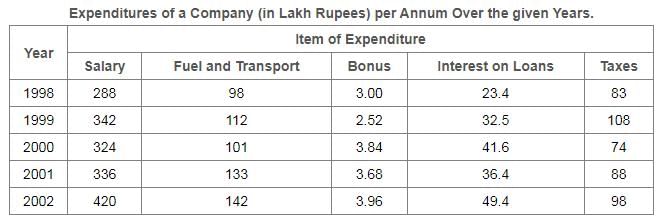
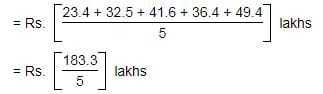
What is the average amount of interest per year which the company had to pay during this period?
What is the average amount of interest per year which the company had to pay during this period?
Study the following table and answer the questions based on it.

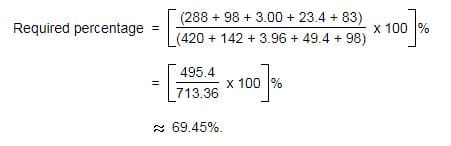
The total amount of bonus paid by the company during the given period is approximately what percent of the total amount of salary paid during this period?
| 1 Crore+ students have signed up on EduRev. Have you? Download the App |
Study the following table and answer the questions based on it.

Total expenditure on all these items in 1998 was approximately what percent of the total expenditure in 2002?
Study the following table and answer the questions based on it.
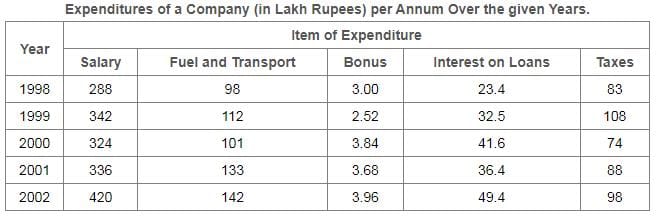
The total expenditure of the company over these items during the year 2000 is?
Study the following table and answer the questions based on it.
The ratio between the total expenditure on Taxes for all the years and the total expenditure on Fuel and Transport for all the years respectively is approximately?
|
218 videos|139 docs|151 tests
|


Important Questions for Practice Test: Table Charts - 3
Practice Test: Table Charts - 3 MCQs with Answers
Online Tests for Practice Test: Table Charts - 3 CSAT Preparation
|
© EduRev
|
Education Revolution
|


Follow Us
|


