UPSC Exam  >  UPSC Tests  >  CSAT Preparation  >  Arun Sharma Test: Pie Chart- 1 - UPSC MCQ

Arun Sharma Test: Pie Chart- 1 - UPSC MCQ


Test Description

5 Questions MCQ Test CSAT Preparation - Arun Sharma Test: Pie Chart- 1

Arun Sharma Test: Pie Chart- 1 for UPSC 2024 is part of CSAT Preparation preparation. The Arun Sharma Test: Pie Chart- 1 questions and answers have been prepared according to the UPSC exam syllabus.The Arun Sharma Test: Pie Chart- 1 MCQs are made for UPSC 2024 Exam. Find important definitions, questions, notes, meanings, examples, exercises, MCQs and online tests for Arun Sharma Test: Pie Chart- 1 below.
Solutions of Arun Sharma Test: Pie Chart- 1 questions in English are available as part of our CSAT Preparation for UPSC & Arun Sharma Test: Pie Chart- 1 solutions in Hindi for CSAT Preparation course. Download more important topics, notes, lectures and mock test series for UPSC Exam by signing up for free. Attempt Arun Sharma Test: Pie Chart- 1 | 5 questions in 7 minutes | Mock test for UPSC preparation | Free important questions MCQ to study CSAT Preparation for UPSC Exam | Download free PDF with solutions
Arun Sharma Test: Pie Chart- 1 - Question 1

The following pie-charts show the distribution of students of graduate and post-graduate levels in seven different institutes in a town.

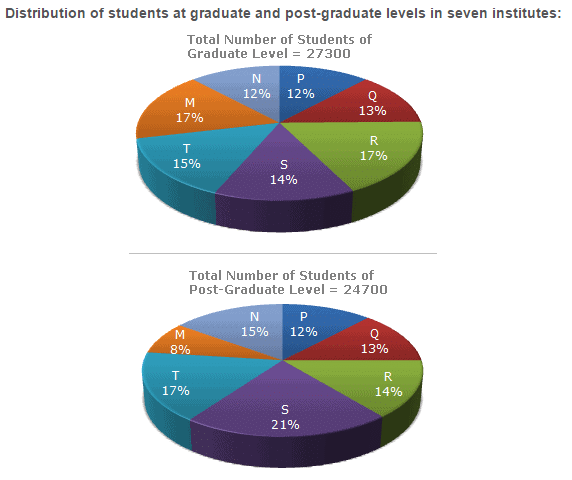
What is the total number of graduate and post-graduate level students is institute R?

Detailed Solution for Arun Sharma Test: Pie Chart- 1 - Question 1

Arun Sharma Test: Pie Chart- 1 - Question 2

The following pie-charts show the distribution of students of graduate and post-graduate levels in seven different institutes in a town.

What is the ratio between the number of students studying at post-graduate and graduate levels respectively from institute S?

Detailed Solution for Arun Sharma Test: Pie Chart- 1 - Question 2

Required =  21% of 24700 /14% 27300 = 19/14

1 Crore+ students have signed up on EduRev. Have you? Download the App
Arun Sharma Test: Pie Chart- 1 - Question 3

The following pie-charts show the distribution of students of graduate and post-graduate levels in seven different institutes in a town.

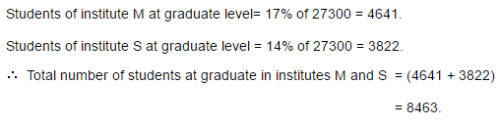
How many students of institutes of M and S are studying at graduate level?

Detailed Solution for Arun Sharma Test: Pie Chart- 1 - Question 3

Arun Sharma Test: Pie Chart- 1 - Question 4

The following pie-charts show the distribution of students of graduate and post-graduate levels in seven different institutes in a town.

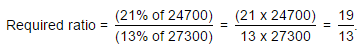
What is the ratio between the number of students studying at post-graduate level from institutes S and the number of students studying at graduate level from institute Q?

Detailed Solution for Arun Sharma Test: Pie Chart- 1 - Question 4

Arun Sharma Test: Pie Chart- 1 - Question 5

The following pie-charts show the distribution of students of graduate and post-graduate levels in seven different institutes in a town.

Total number of students studying at post-graduate level from institutes N and P is

Detailed Solution for Arun Sharma Test: Pie Chart- 1 - Question 5

218 videos|139 docs|151 tests
Information about Arun Sharma Test: Pie Chart- 1 Page
In this test you can find the Exam questions for Arun Sharma Test: Pie Chart- 1 solved & explained in the simplest way possible. Besides giving Questions and answers for Arun Sharma Test: Pie Chart- 1, EduRev gives you an ample number of Online tests for practice

Top Courses for UPSC

218 videos|139 docs|151 tests
Download as PDF

Top Courses for UPSC