UPSC Exam  >  UPSC Tests  >  CSAT Preparation  >  Practice Test: Table Charts - 1 - UPSC MCQ

Practice Test: Table Charts - 1 - UPSC MCQ


Test Description

10 Questions MCQ Test CSAT Preparation - Practice Test: Table Charts - 1

Practice Test: Table Charts - 1 for UPSC 2024 is part of CSAT Preparation preparation. The Practice Test: Table Charts - 1 questions and answers have been prepared according to the UPSC exam syllabus.The Practice Test: Table Charts - 1 MCQs are made for UPSC 2024 Exam. Find important definitions, questions, notes, meanings, examples, exercises, MCQs and online tests for Practice Test: Table Charts - 1 below.
Solutions of Practice Test: Table Charts - 1 questions in English are available as part of our CSAT Preparation for UPSC & Practice Test: Table Charts - 1 solutions in Hindi for CSAT Preparation course. Download more important topics, notes, lectures and mock test series for UPSC Exam by signing up for free. Attempt Practice Test: Table Charts - 1 | 10 questions in 10 minutes | Mock test for UPSC preparation | Free important questions MCQ to study CSAT Preparation for UPSC Exam | Download free PDF with solutions
Practice Test: Table Charts - 1 - Question 1

Directions: Read the table given below and answer the questions accordingly.

Shares traded in Chandigarh, Punjab, Haryana (In Rupees)
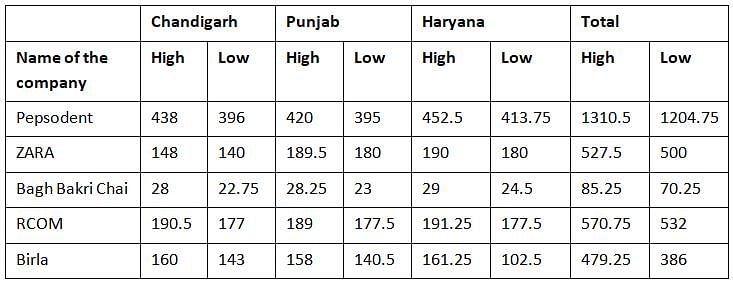
Q. The average for the high rates of Chandigarh for all the companies was

Detailed Solution for Practice Test: Table Charts - 1 - Question 1

The average for all the high involved with the Chandigarh region was

(438 + 148 + 28 + 190.5 + 160)/5 which gives 192.9.

Practice Test: Table Charts - 1 - Question 2

Directions: Read the table given below and answer the questions accordingly.

Shares traded in Chandigarh, Punjab, Haryana (In Rupees)

Q. Total of low value of the Punjab region exceeds the total of the low value of the region of Haryana by how much?

Detailed Solution for Practice Test: Table Charts - 1 - Question 2

Total value for the low of the Punjab region for the given companies is 395 + 180 + 23 + 177.5 + 140.5 = 916

whereas the total for the low of the Haryana region is 413.75 + 180 + 24.5 + 177.5 + 102.5 = 898.25.

So it exceeds by 916 – 898.25 = 17.75.

1 Crore+ students have signed up on EduRev. Have you? Download the App
Practice Test: Table Charts - 1 - Question 3

Directions: Read the table given below and answer the questions accordingly.

Shares traded in Chandigarh, Punjab, Haryana (In Rupees)

Q. Low for RCOM for all the given states/UT form what percent of the low for ZARA for the same?

Detailed Solution for Practice Test: Table Charts - 1 - Question 3

The total of lows for the RCOM for all the given states/ UT are given to be 532 and the ZARA has the total for their lows to be 500.

Thus ATQ (532/500)*100 = 106.4%

Practice Test: Table Charts - 1 - Question 4

Directions: Read the table given below and answer the questions accordingly.

Shares traded in Chandigarh, Punjab, Haryana (In Rupees)

Q. High for Chandigarh for BIRLA form what percent of the High for BIRLA for Punjab and Haryana combined?

Detailed Solution for Practice Test: Table Charts - 1 - Question 4

High for the company "BIRLA" in Chandigarh was 160 and Total of high in Punjab and Haryana happen to be 319.25.

So, ATQ the percentage required will be (160/319.25) * 100 = 50% approx.

Practice Test: Table Charts - 1 - Question 5

Directions: Read the table given below and answer the questions accordingly.

Shares traded in Chandigarh, Punjab, Haryana (In Rupees)

Q. Total of high for all the companies in all the States/UT are more than the lows for all the states/UT by how much?

Detailed Solution for Practice Test: Table Charts - 1 - Question 5

The total of high for all the given places is 2973.25 whereas the low totals to 2693.

So the given data differ by 280.25.

Practice Test: Table Charts - 1 - Question 6

Directions: Study the following graph carefully and answer the questions given below:

Production (in Lakhs) of  Widgets  & Percentage defect over the years in five factories A, B, C, D, E.

Q. The average production for the given data will be maximum for which factory?

Detailed Solution for Practice Test: Table Charts - 1 - Question 6

If we look closely then we will find that the production of factory A happens to be maximum and thus its average will also be highest.

We can also verify this by calculating the number of widgets individually and dividing it by the number of given years i.e. 6.

Practice Test: Table Charts - 1 - Question 7

Directions: Study the following graph carefully and answer the questions given below:

Production (in Lakhs) of  Widgets  & Percentage defect over the years in five factories A, B, C, D, E.

Q. What was the difference in defected widgets of factory C for the year 2006 and defected widgets of factory E for the year 2003?

Detailed Solution for Practice Test: Table Charts - 1 - Question 7

Reqd. No. = (15% of 420000) - (8% of 400000) = 63000 - 32000 = 31000

Practice Test: Table Charts - 1 - Question 8

Directions: Study the following graph carefully and answer the questions given below:

Production (in Lakhs) of  Widgets  & Percentage defect over the years in five factories A, B, C, D, E.
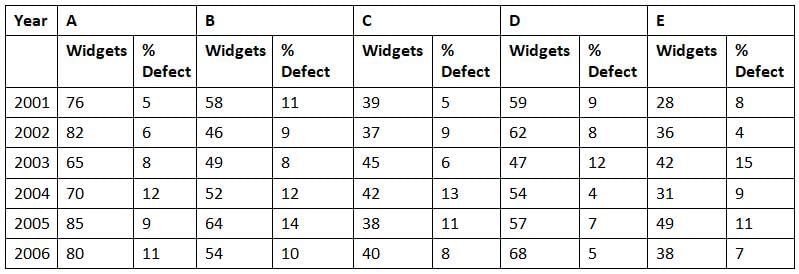
Q. The average number of widgets that were produced in the year 2002 formed what percent of the widgets that were produced in the year 2006?

Detailed Solution for Practice Test: Table Charts - 1 - Question 8

The total of the widgets that were produced in the year 2002 was 263(Lakhs) and the ones produced in the year 2006 were 280(Lakhs).

The percentage value is (263/280) x 100 = 94 % (approx).

Practice Test: Table Charts - 1 - Question 9

Directions: Study the following graph carefully and answer the questions given below:

Production (in Lakhs) of  Widgets  & Percentage defect over the years in five factories A, B, C, D, E.
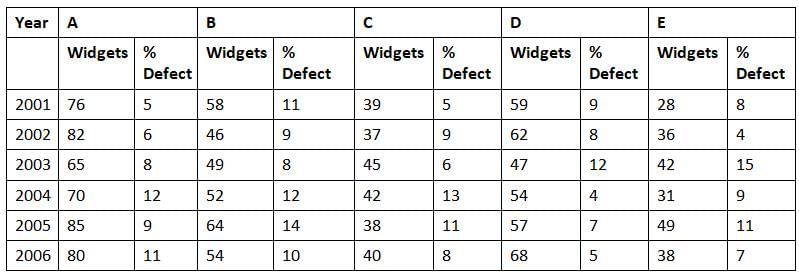
Q. What was the difference in the number of widgets of factory C which were free from any defect in the years 2004 and 2006?

Detailed Solution for Practice Test: Table Charts - 1 - Question 9

Required difference = (92% of 400000) - (87% of 420000) =36800 - 36540= 260

So the difference is 260

Practice Test: Table Charts - 1 - Question 10

Directions: Study the following table carefully and answer the questions given below.

Number of candidates appeared (App.) and percentage of candidates qualified (Qual.) under different disciplines over the years.

Q. Approximately, what was the percentage increase in the number of candidates who appeared under the German stream from 2013 to 2014(approx)?

Detailed Solution for Practice Test: Table Charts - 1 - Question 10

Number of students in the year 2013 were 985 and they increased to 1215,

so there was a net increase of 230.

Talking of percentage there was an increase of 230 in the initial value 985,

so the increase will be (230/985)*100 = 23.35%

218 videos|139 docs|151 tests
Information about Practice Test: Table Charts - 1 Page
In this test you can find the Exam questions for Practice Test: Table Charts - 1 solved & explained in the simplest way possible. Besides giving Questions and answers for Practice Test: Table Charts - 1, EduRev gives you an ample number of Online tests for practice

Top Courses for UPSC

218 videos|139 docs|151 tests
Download as PDF

Top Courses for UPSC