Test: Line Charts- 3 - CAT MCQ
Test Description
5 Questions MCQ Test - Test: Line Charts- 3
Test: Line Charts- 3 for CAT 2025 is part of CAT preparation. The Test: Line Charts- 3 questions and answers have been prepared
according to the CAT exam syllabus.The Test: Line Charts- 3 MCQs are made for CAT 2025 Exam.
Find important definitions, questions, notes, meanings, examples, exercises, MCQs and online tests for Test: Line Charts- 3 below.
Solutions of Test: Line Charts- 3 questions in English are available as part of our course for CAT & Test: Line Charts- 3 solutions in
Hindi for CAT course.
Download more important topics, notes, lectures and mock test series for CAT Exam by signing up for free. Attempt Test: Line Charts- 3 | 5 questions in 10 minutes | Mock test for CAT preparation | Free important questions MCQ to study for CAT Exam | Download free PDF with solutions
Test: Line Charts- 3 - Question 1

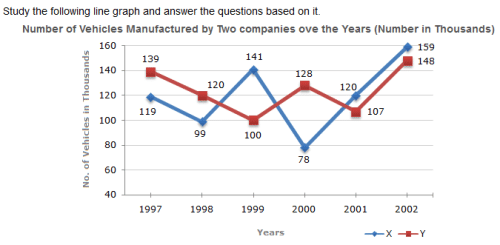
What is the difference between the number of vehicles manufactured by Company Y in 2000 and 2001 ?
Detailed Solution for Test: Line Charts- 3 - Question 1
Test: Line Charts- 3 - Question 2

What is the difference between the total productions of the two Companies in the given years ?
Detailed Solution for Test: Line Charts- 3 - Question 2
Test: Line Charts- 3 - Question 3

What is the average numbers of vehicles manufactured by Company X over the given period ? (rounded off to nearest integer)
Detailed Solution for Test: Line Charts- 3 - Question 3
Test: Line Charts- 3 - Question 4
In which of the following years, the difference between the productions of Companies X and Y was the maximum among the given years ?
Detailed Solution for Test: Line Charts- 3 - Question 4
Test: Line Charts- 3 - Question 5
The production of Company Y in 2000 was approximately what percent of the production of Company X in the same year ?
Detailed Solution for Test: Line Charts- 3 - Question 5
Information about Test: Line Charts- 3 Page
In this test you can find the Exam questions for Test: Line Charts- 3 solved & explained in the simplest way possible.
Besides giving Questions and answers for Test: Line Charts- 3, EduRev gives you an ample number of Online tests for practice
Download as PDF


