Test: Line Charts- 2 - Civil Engineering (CE) MCQ
5 Questions MCQ Test - Test: Line Charts- 2

Practice Quiz or MCQ (Multiple Choice Questions) with solutions are available for Practice, which would help you prepare for "Line Charts" under LR and DI. You can practice these practice quizzes as per your speed and improvise the topic. The same topic is covered under various competitive examinations like - CAT, GMAT, Bank PO, SSC and other competitive examinations.
Q.
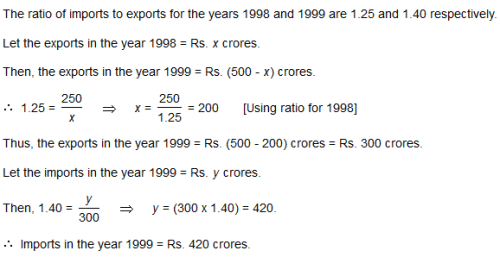
The following line graph gives the ratio of the amounts of imports by a company to the amount of exports from that company over the period from 1995 to 2001.
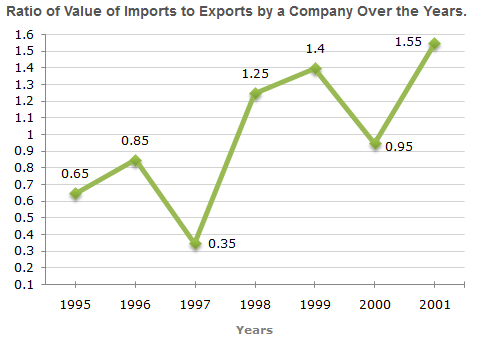
If the imports in 1998 was Rs. 250 crores and the total exports in the years 1998 and 1999 together was Rs. 500 crores, then the imports in 1999 was ?
The following line graph gives the ratio of the amounts of imports by a company to the amount of exports from that company over the period from 1995 to 2001.
The imports were minimum proportionate to the exports of the company in the year ?

The following line graph gives the ratio of the amounts of imports by a company to the amount of exports from that company over the period from 1995 to 2001.
What was the percentage increase in imports from 1997 to 1998 ?
The following line graph gives the ratio of the amounts of imports by a company to the amount of exports from that company over the period from 1995 to 2001.
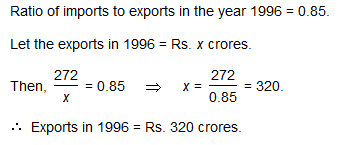
If the imports of the company in 1996 was Rs. 272 crores, the exports from the company in 1996 was ?
The following line graph gives the ratio of the amounts of imports by a company to the amount of exports from that company over the period from 1995 to 2001.
In how many of the given years were the exports more than the imports ?
Important Questions for Line Charts- 2
Line Charts- 2 MCQs with Answers
Online Tests for Line Charts- 2
|
© EduRev
|
Education Revolution
|


|


