Practice Test: Pie Chart - 1 - CAT MCQ
5 Questions MCQ Test - Practice Test: Pie Chart - 1

Instructions: On the basis of the information given below, answer the questions that follow.
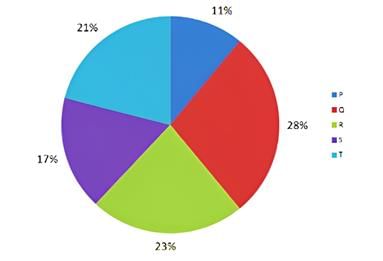
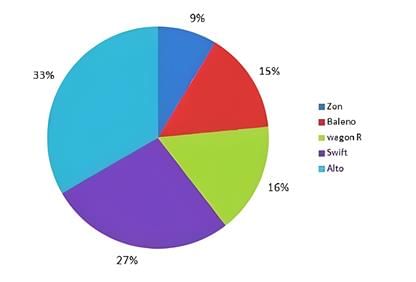
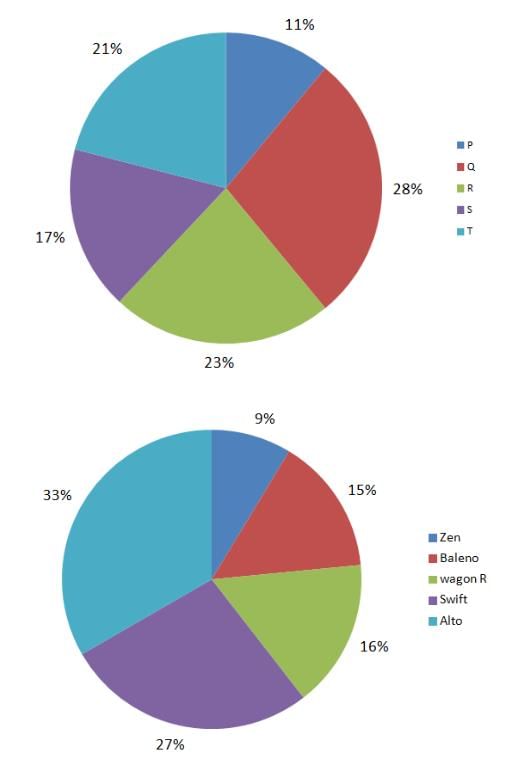
Maruti Suzuki has tie-ups with five dealers in Allahabad to sell their cars. The first pie chart given below gives the dealer-wise break-up of the number of cars sold by Maruti Suzuki in Allahabad in 2015. The second pie chart shows the model-wise breakup of the total cars sold by Maruti Suzuki in 2015 in Allahabad.

Q. If the dealer T sold an equal number of all five models of Maruti Suzuki then what is the maximum share(in %) that T can have in total sales of any model?(Enter only the integer value rounded off to nearest integer. Don’t put % sign)
Q. If the dealer T sold an equal number of all five models of Maruti Suzuki then what is the maximum share(in %) that T can have in total sales of any model?(Enter only the integer value rounded off to nearest integer. Don’t put % sign)
Instructions: On the basis of the information given below, answer the questions that follow.
Maruti Suzuki has tie-ups with five dealers in Allahabad to sell their cars. The first pie chart given below gives the dealer-wise break-up of the number of cars sold by Maruti Suzuki in Allahabad in 2015. The second pie chart shows the model-wise breakup of the total cars sold by Maruti Suzuki in 2015 in Allahabad.
Q. If the dealers R and S sold only Zen, Baleno and swift then at least what percentage of the Swifts sold, were sold by these two dealers alone? (Enter only the integer value rounded off to nearest integer. Don’t put % sign)

Instructions: On the basis of the information given below, answer the questions that follow.
Maruti Suzuki has tie-ups with five dealers in Allahabad to sell their cars. The first pie chart given below gives the dealer-wise break-up of the number of cars sold by Maruti Suzuki in Allahabad in 2015. The second pie chart shows the model-wise breakup of the total cars sold by Maruti Suzuki in 2015 in Allahabad.
Q. If for any dealer, the percentage of Wagon R’s sold by him did not exceed 25% of his total sales, then at least how many dealers sold Wagon R?
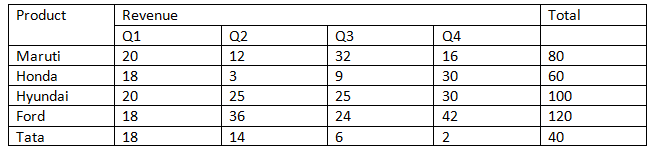
Instructions: The pie chart shown below gives the percentage distribution of car sales (in
numbers) between five companies – Maruti, Honda, Hyundai, Ford and Tata during the year 2014 – 2015. The total number of cars sold by the five companies together in 2014-2015 is four hundred thousand.
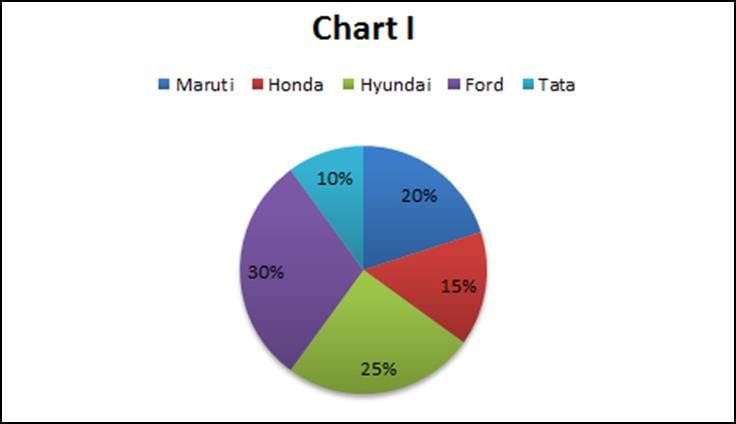
The line graph shown below gives the percentage distribution of the number of cars sold by each of the five companies in the four different Quarters of the year.
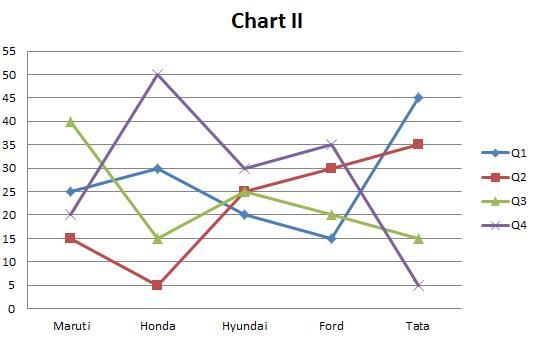
Q. Which company sold the highest number of cars in the second quarter?
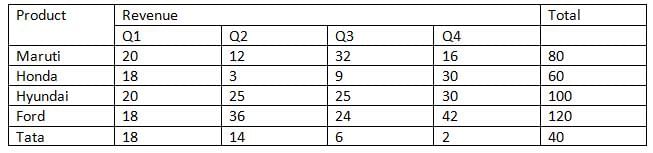
Instructions: The pie chart shown below gives the percentage distribution of car sales (in
numbers) between five companies – Maruti, Honda, Hyundai, Ford and Tata during the year 2014 – 2015. The total number of cars sold by the five companies together in 2014-2015 is four hundred thousand.

The line graph shown below gives the percentage distribution of the number of cars sold by each of the five companies in the four different Quarters of the year.

Q. In how many quarters were the number of cars sold by any two companies in that quarter the same?


Important Questions for Practice Test: Pie Chart - 1
Practice Test: Pie Chart - 1 MCQs with Answers
Online Tests for Practice Test: Pie Chart - 1
|
© EduRev
|
Education Revolution
|


|


