CA Foundation Exam  >  CA Foundation Tests  >  Test: Correlation And Regression- 1 - CA Foundation MCQ

Test: Correlation And Regression- 1 - CA Foundation MCQ


Test Description

30 Questions MCQ Test - Test: Correlation And Regression- 1

Test: Correlation And Regression- 1 for CA Foundation 2025 is part of CA Foundation preparation. The Test: Correlation And Regression- 1 questions and answers have been prepared according to the CA Foundation exam syllabus.The Test: Correlation And Regression- 1 MCQs are made for CA Foundation 2025 Exam. Find important definitions, questions, notes, meanings, examples, exercises, MCQs and online tests for Test: Correlation And Regression- 1 below.
Solutions of Test: Correlation And Regression- 1 questions in English are available as part of our course for CA Foundation & Test: Correlation And Regression- 1 solutions in Hindi for CA Foundation course. Download more important topics, notes, lectures and mock test series for CA Foundation Exam by signing up for free. Attempt Test: Correlation And Regression- 1 | 40 questions in 40 minutes | Mock test for CA Foundation preparation | Free important questions MCQ to study for CA Foundation Exam | Download free PDF with solutions
Test: Correlation And Regression- 1 - Question 1

(Direction 1-40) Write the correct answers. Each question carries 1 mark.

Q. Bivariate Data are the data collected for

Detailed Solution for Test: Correlation And Regression- 1 - Question 1

The primary purpose of bivariate data is to compare the two sets of data or to find a relationship between the two variables.

Test: Correlation And Regression- 1 - Question 2

For a bivariate frequency table having (p + q) classification the total number of cells is

Test: Correlation And Regression- 1 - Question 3

Some of the cell frequencies in a bivariate frequency table may be

Test: Correlation And Regression- 1 - Question 4

For a p x q bivariate frequency table, the maximum number of marginal distributions is

Test: Correlation And Regression- 1 - Question 5

For a p x q classification of bivariate data, the maximum number of conditional distributions is

Test: Correlation And Regression- 1 - Question 6

Correlation analysis aims at

Test: Correlation And Regression- 1 - Question 7

Regression analysis is concerned with

Test: Correlation And Regression- 1 - Question 8

What is spurious correlation?

Test: Correlation And Regression- 1 - Question 9

Scatter diagram is considered for measuring

Test: Correlation And Regression- 1 - Question 10

If the plotted points in a scatter diagram lie from upper left to lower right, then the correlation is

Test: Correlation And Regression- 1 - Question 11

If the plotted points in a scatter diagram are evenly distributed, then the correlation is

Detailed Solution for Test: Correlation And Regression- 1 - Question 11

When points in a scatter diagram are evenly distributed in a random pattern, it means that there is no discernible trend or relationship between the two variables being plotted. This lack of a pattern indicates that as one variable changes, the other does not change in any predictable way.

In terms of correlation:

  • Positive correlation: The points would trend upward from left to right, indicating that as one variable increases, the other also increases.
  • Negative correlation: The points would trend downward from left to right, indicating that as one variable increases, the other decreases.
  • Zero correlation: The points are scattered randomly without any clear upward or downward trend, showing no relationship between the variables.

Therefore, when the points are evenly distributed in a scatter diagram without any discernible pattern, the correlation is zero, meaning there's no linear relationship between the variables.

Test: Correlation And Regression- 1 - Question 12

If all the plotted points in a scatter diagram lie on a single line, then the correlation is

Test: Correlation And Regression- 1 - Question 13

The correlation between shoe-size and intelligence is

Test: Correlation And Regression- 1 - Question 14

The correlation between the speed of an automobile and the distance travelled by it after applying the brakes is

Detailed Solution for Test: Correlation And Regression- 1 - Question 14

When brakes are applied, the stopping distance s is given by s = v2 / (2 a), where v is the initial speed and a is the deceleration. Since stopping distance varies as the square of the speed, higher speed leads to a longer distance before stopping. This shows a positive correlation between speed and distance travelled under braking.

Test: Correlation And Regression- 1 - Question 15

Scatter diagram helps us to

Test: Correlation And Regression- 1 - Question 16

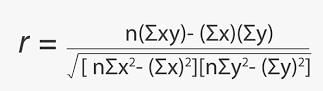
Pearson’s correlation coefficient is used for finding

Test: Correlation And Regression- 1 - Question 17

Product moment correlation coefficient is considered for

Test: Correlation And Regression- 1 - Question 18

If the value of correlation coefficient is positive, then the points in a scatter diagram tend to cluster

Test: Correlation And Regression- 1 - Question 19

A process by which we estimate the value of dependent variable on the basis of one or more independent variables is called:

Test: Correlation And Regression- 1 - Question 20

Product moment correlation coefficient may be defined as the ratio of

Detailed Solution for Test: Correlation And Regression- 1 - Question 20

The correlation coefficient is defined as the covariance divided by the standard deviation of the variables. The following formula is used to calculate the Pearson r correlation:

Test: Correlation And Regression- 1 - Question 21

The covariance between two variables is

Test: Correlation And Regression- 1 - Question 22

The coefficient of correlation between two variables

Test: Correlation And Regression- 1 - Question 23

What are the limits of the correlation coefficient?

Test: Correlation And Regression- 1 - Question 24

In case the correlation coefficient between two variables is 1, the relationship between the two variables would be

Test: Correlation And Regression- 1 - Question 25

If the relationship between two variables x and y in given by 2x + 3y + 4 = 0, then the value of the correlation coefficient between x and y is

Test: Correlation And Regression- 1 - Question 26

For finding correlation between two attributes, we consider

Test: Correlation And Regression- 1 - Question 27

For finding the degree of agreement about beauty between two Judges in a Beauty Contest, we use

Test: Correlation And Regression- 1 - Question 28

If there is a perfect disagreement between the marks in Geography and Statistics, then what would be the value of rank correlation coefficient?

Test: Correlation And Regression- 1 - Question 29

When we are not concerned with the magnitude of the two variables under discussion, we consider

Test: Correlation And Regression- 1 - Question 30

What is the quickest method to find correlation between two variables?

View more questions
Information about Test: Correlation And Regression- 1 Page
In this test you can find the Exam questions for Test: Correlation And Regression- 1 solved & explained in the simplest way possible. Besides giving Questions and answers for Test: Correlation And Regression- 1, EduRev gives you an ample number of Online tests for practice
Download as PDF