GMAT Exam  >  GMAT Tests  >  GMAT Mock Test Series 2025  >  Test: Data Insights - 3 - GMAT MCQ

Test: Data Insights - 3 - GMAT MCQ


Test Description

20 Questions MCQ Test GMAT Mock Test Series 2025 - Test: Data Insights - 3

Test: Data Insights - 3 for GMAT 2025 is part of GMAT Mock Test Series 2025 preparation. The Test: Data Insights - 3 questions and answers have been prepared according to the GMAT exam syllabus.The Test: Data Insights - 3 MCQs are made for GMAT 2025 Exam. Find important definitions, questions, notes, meanings, examples, exercises, MCQs and online tests for Test: Data Insights - 3 below.
Solutions of Test: Data Insights - 3 questions in English are available as part of our GMAT Mock Test Series 2025 for GMAT & Test: Data Insights - 3 solutions in Hindi for GMAT Mock Test Series 2025 course. Download more important topics, notes, lectures and mock test series for GMAT Exam by signing up for free. Attempt Test: Data Insights - 3 | 20 questions in 45 minutes | Mock test for GMAT preparation | Free important questions MCQ to study GMAT Mock Test Series 2025 for GMAT Exam | Download free PDF with solutions
Test: Data Insights - 3 - Question 1

If machine X ran continuously at a uniform rate to fill a production order, at what time did the machine finish filling the order?

(1) Machine X had filled 2/3 of the order by 10:00 a.m. and 5/6 of the order by 10:30 a.m.

(2) Machine X had filled 1/6 of the order by 8:30 a.m. and 1/3 of the order by 9:00 a.m.
 

Detailed Solution for Test: Data Insights - 3 - Question 1

Statement (1)
- At 10:00 a.m., machine X had completed 2/3 of the order.
- At 10:30 a.m., machine X had completed 5/6 of the order.

From this, we can determine the rate of the machine:
- In 30 minutes, it completed (5/6 - 2/3) = (10/12 - 8/12) = 2/12 = 1/6 of the order.
- This means the machine fills 1/6 of the order every 30 minutes.
- Since 5/6 of the order was completed by 10:30 a.m., the remaining 1/6 will take another 30 minutes, so the order is completed at 11:00 a.m

Sufficient.

Statement (2)
- At 8:30 a.m., machine X had completed 1/6 of the order.
- At 9:00 a.m., machine X had completed 1/3 of the order.

From this, we can determine the rate:
- In 30 minutes, it completed (1/3 - 1/6) = (2/6 - 1/6) = 1/6 of the order.
- Since the machine fills 1/6 of the order every 30 minutes, we can compute the completion time.

Sufficient.

Option D

Test: Data Insights - 3 - Question 2

Jaspher invested in two ventures A and B, with rates of interest at 5k% and 3k%, respectively. What was the initial investment Jaspher made in venture B?

(1) The amount Jaspher invested in venture B was five times the amount he invested in venture A.

(2) The interest from venture B was $150 while the interest from venture A was $50.

Detailed Solution for Test: Data Insights - 3 - Question 2

Answer:(E)

Let the initial investment in venture A be denoted as 'a', and the initial investment in venture B be 'b'. 

The question is asking for the value of 'b'.

Statement (1):

This statement tells you that the initial investment in venture B is five times the initial investment in venture A. 

In mathematical terms, this gives you b = 5a. 

However, without knowing the value of 'a', you cannot determine the value of 'b'. Thus, statement (1) alone is not sufficient.

Statement (2):

This statement tells you that 'a' dollars earning interest at a rate of 5k% equals $50, and 'b' dollars earning interest at a rate of 3k% equals $150. 

This gives you two equations: 5k/100 * a = $50 and 

3k/100 * b = $150.

Manipulating these equations, we get:

a = $50 / (5k/100) and

b = $150 / (3k/100)

Dividing, these we get,

a/b = 1/5

However, we can't figure out the individual values of 'a' and 'b' as the value of 'k' is not given. So, statement (2) alone is also not sufficient.

Taking BOTH statements TOGETHER, we still can't determine the value of 'b' because we do not know the value of 'k'. Both statements together simply confirm that b = 5a, but without the value of 'k', we cannot determine the individual values of 'a' and 'b'. Therefore, BOTH statements TOGETHER are NOT sufficient.

The correct answer is (E).

Test: Data Insights - 3 - Question 3

The graph shows how the solubility of various chemicals varies with temperature. The solubility is measured as grams of dissolved chemical (solute) per 100 grams of water.

Under the assumption that the curves shown continue in the same general shape beyond the plotted area, use the drop-down menus to complete each of the following statements in the manner that most accurately reflects the information provided.

1. At 60°C, the most soluble of the chemicals is most likely__________.
2. There is most likely a temperature above 100°C at which NH4Cl is exactly as soluble as ___________.

Detailed Solution for Test: Data Insights - 3 - Question 3

By following the gridline at 60°C, the visible line indicating the solubility of NaNO3 is highest on the graph. However, the line for KI extends above the scale shown on the graph. So, given the assumption that the curves continue in the same general shape beyond the plotted area, the information given indicates that KI is the most soluble at 60°C.

The correct answer is KI.

The vertical distance between the solubility curves for KClO3 and NH4Cl decreases as the temperature increases, thus the difference in solubility between KClO3 and NH4Cl decreases as the temperature increases. Assuming that the curves continue in the same general shape beyond the plotted area, the vertical distance between them will eventually be zero, thereby indicating that there is a temperature at which the two chemicals are equally soluble. By contrast, the solubility curves for KCl and NaCl have increasingly greater vertical distances from that of NH4Cl as the temperature increases. Thus the differences in the solubilities of either KCl or NaCl as compared to that of NH4Cl would continue to increase as the temperature increases.

The correct answer is KClO3.

Test: Data Insights - 3 - Question 4

The graph shows the number of shipments handled by each of 6 delivery companies over the past 5 years.


Select from each drop-down menu the option that creates the most accurate statement based on the information provided.
Over the past 5 years, the Delivery Company (i)_______ handled exactly 60% more shipments than Delivery Company (ii)________.

Detailed Solution for Test: Data Insights - 3 - Question 4

The correct answer is Company D handled exactly 60% more shipments than Delivery Company B.

To solve this question, we need to find 2 numbers such that 1.6 * x = y, where x and y are both whole numbers.
When multiplied by 1.6, only muliples of 5 (e.g. 5,10,15, etc.) result in a while number.

Only Company B satisfies this criteria with x =5.
Therefore, y must be 1.6 * 5 = 8.­

Test: Data Insights - 3 - Question 5


Consider each of the following statements. Does the information in the three sources support the inference as stated?

Detailed Solution for Test: Data Insights - 3 - Question 5

Part 1: The median retail cost of the product line is $20.40.

The median retail cost of product is $34.

Hence, the answer is No.

Part 2: Loyal members who purchase online save more than 50% off the cost of their total purchases and shipping compared to nonmembers.

Let x be the shipping cost.

Let's consider a member and a non member purchase 1 unit of Renew Soap.

Cost for member = 27
Cost for non member = 45 + x

Savings of a member compared to a non member = 18 + x

Translating the question statement: Is (18 + x) more than 50% of (45 + x)

Is (18 + x) > (45 + x)/2
Is (18+x)/(45+x) > 1/2

We can clearly see that the answer is No.

Hence, the final answer is No.

Part 3: The minimum purchase amount within the 6-month introductory period is less than the $50.00 charge issued to accounts that are canceled early.

The minimum amount within the 6 month introductory period = Price of Detox Tea * 6 = 10.2 *6 = $61.2

Hence, the answer is No.

Test: Data Insights - 3 - Question 6


If the information contained in all three sources is correct, the member price of
an item that retails for $65.00 will be closest to:

Detailed Solution for Test: Data Insights - 3 - Question 6

Member Price = 60% of 65 = $39

Hence, the answer is $39.

Test: Data Insights - 3 - Question 7

Parliamentarians in Nation X are debating how national government funds allocated for education should be distributed to the country's 23 provinces. According to Parliamentarian 1, when a province has a greater number of children under 18 years of age than another province has, the province with the greater number of children should receive more funding. Parliamentarian 2 states that when one province contributes more in taxes to the national government than another province contributes, the province that contributes more should receive more funding. Current data for the 23 provinces are provided in the table.


For each of the following consoles, select Yes if the console is ratings-dominant over any of the other consoles in the table. Otherwise, select No.

Detailed Solution for Test: Data Insights - 3 - Question 7

Parliamentarian 1:
Rule – If a province has more children under 18 than another province, it should also receive more educational funding.

We check for violations:

  • Example: Province A has 711 children and funding 2688, Province B has 821 children but only 196 funding → violation.

  • This kind of mismatch occurs multiple times in the table.

Conclusion → Condition NOT satisfied for Parliamentarian 1.

Parliamentarian 2:
Rule – If a province contributes more taxes than another province, it should also receive more educational funding.

We check for violations:

  • Example: Province A taxes 22648, funding 2688; Province B taxes 1411 but has funding 196 → fine.
    But comparing Province C (tax 20754, funding 3597) with Province D (tax 1149, funding 3875) → D has less tax but more funding → violation.

Conclusion → Condition NOT satisfied for Parliamentarian 2.

Final check:
Since both individual conditions fail, the "both" condition fails too.

Answers:

  • First option (Parliamentarian 1) → No

  • Second option (Parliamentarian 2) → No

  • Third option (Neither condition) → Yes

Test: Data Insights - 3 - Question 8


The above table shows, for different cities, the percentage of population of a city which is a regular visitor to different locations in the city. For example: 85% of the people in Atlanta are regular visitors to department stores, and 12% of the people in New York are regular visitors to public parks.
Select Would Explain if the statement explains some of the information in the table. Otherwise, select Would not Explain.

Detailed Solution for Test: Data Insights - 3 - Question 8

Part 1:
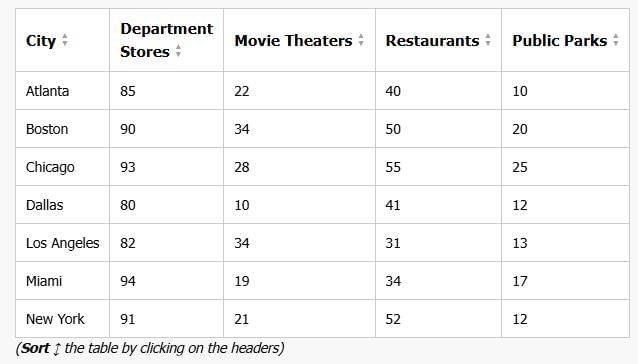
A majority of people living in these cities do not have easy access to a public park.

  • In the table, Public Park percentages are quite low (10–25%). Lack of access could explain these low figures.
    → Would Explain

Part 2:
The proportion of residents that live in proximity of a movie theater is lower in Dallas than in Boston and Los Angeles.

  • Dallas has 10% regular visitors to movie theaters, far less than Boston (34%) and Los Angeles (31%). Less proximity would explain this.
    → Would Explain

Part 3:
The proportion of people who prefer to spend time indoors is greater in Dallas than in Chicago.

  • If Dallas had a greater indoor preference, it should have higher percentages for department stores, movie theaters, and restaurants. But Dallas is lower than Chicago in all three indoor categories.
    → Would Not Explain

d) Part 1: Would Explain; Part 2: Would Explain; Part 3: Would Not Explain

Test: Data Insights - 3 - Question 9

Archeologists excavating at a certain site have found the following five artifacts: a bowl, a cup, a jug, a statue, and an urn. At this site, the greater the depth at which an artifact was found, the older that artifact is. The bowl was determined to be x years old and was found at a depth of d meters. Both the cup and the jug were found at a depth of less than d meters. The statue was determined to be 1.5x years old, and the urn was found at a greater depth than the statue was.

Each of the following statements pertains to the five artifacts found at the site. Assuming that the information provided is correct, select for Must be true the statement that must be true and select for Must be false the statement that must be false. Make only two selections, one in each column.

Detailed Solution for Test: Data Insights - 3 - Question 9

  • The greater the depth at which an artifact was found, the older that artifact is.
  • The bowl was determined to be x years old and was found at a depth of d meters.
  • Both the cup and the jug were found at a depth of less than d meters.
  • The statue was determined to be 1.5x years old, and the urn was found at a greater depth than the statue was.
  • The order of age from oldest to youngest is: urn, statue, bowl, {cup, jug}. The order of depth from deepest to shallowest is: urn, statue, bowl, {cup, jug}.

"Must be True" choice:

  • "The median of the artifacts' ages is x years." To evaluate this statement, we need to arrange the artifacts in the order of their age. The median is the middle value when all values are sorted in ascending or descending order. Here, the bowl is the middle artifact in terms of age, and the bowl is x years old. Therefore, the median age is x years.

"Must be False" choice:

  • "The urn is less than 1.5x years old." Given that the urn was found at a greater depth than the statue, and that a greater depth corresponds to an older age, we can deduce that the urn is older than the statue. We know the statue is 1.5x years old, so the urn must be older than 1.5x years. Therefore, the statement "the urn is less than 1.5x years old" must be false.
Test: Data Insights - 3 - Question 10

On Christmas Eve, Santa and 5 of his elves need to deliver 210 presents to 7 towns, with each one requiring exactly 30 presents. Each trip to a town and back takes 1 hour, several trips can be made simultaneously, and each one requires at least Santa or two elves. Santa can deliver at most 15 presents per trip, and each elf can deliver at most 10 presents per trip.

Based on the information above, select for T1 the number of minimum hours it will take to deliver all 210 presents with Santa and T2 the number of minimum hours it will take to deliver all 210 presents without Santa.

Detailed Solution for Test: Data Insights - 3 - Question 10


Test: Data Insights - 3 - Question 11

According to a survey, at least 70% of students in a college study Hindi, at least 75% of students study French, and at least 80% of students study German. If x is the minimum percentage of students who study all three languages and y is the maximum percentage of students who study all three languages, then choose the appropriate values for x and y from the table given below:

Detailed Solution for Test: Data Insights - 3 - Question 11

For y i.e. maximum, we have at least 70, 75 and 80. Here, the minimum of subsets is 70 so y=70%.
For x, we can get minimum if we assume students studying both subjects as the maximum.
Let, total students=100a. H=70a, F=75a, G=80a.
100a=70a+75a+80a - 100a (assuming maximum) - x
200a-225a=-x or, x=25a i.e. 25%.
x=25, y=70.

Test: Data Insights - 3 - Question 12

Alejandra is designing a game of chance. For one part of the game, a player is to randomly choose 3 marbles, without replacement, from a box containing B blue marbles, R red marbles, and no other marbles. Alejandra correctly determined the positive integers B and R so that the number of possible selections in which 1 blue marble and 2 red marbles are chosen is twice the number of possible selections in which 2 blue marbles and 1 red marble are chosen.
The positive integers B and R that Alejandra determined must be such that B is the number that is __ 1 __ and R is the number that is __ 2 __.
Based on the information provided, select for 1 and for 2 the options that create the most accurate statement. Make only two selections, one in each column.

Detailed Solution for Test: Data Insights - 3 - Question 12


R−1 = 2B − 2

R = 2B − 1

Test: Data Insights - 3 - Question 13

Which of the following can be reasonably inferred from the data provided?

Detailed Solution for Test: Data Insights - 3 - Question 13

Results for Sara, Angel, and John can be misleading (taking medication, underage)
So, any conclusions for them will not be reliable. Only option C is correct because Ramesh's data is reliable and he is clearly near the 2-minute average mark at which disorders are very likely.

Test: Data Insights - 3 - Question 14

Based on the information presented, some of the patients have MSLT data that could be misleading and others do not. For the following statements, select Yes if the scenario provided would change that status for any of the five patients. Otherwise select No.

Detailed Solution for Test: Data Insights - 3 - Question 14

1. [no] There was a major noise disturbance in the sleep center on 6/17/17.
- Sara was tested on that date and she already had misleading data. So, her status of whether she has misleading data does not change (she had misleading data before, and now after the noise she still has misleading data, even if the actual data changes further)
2. [no] None of the patients who had a sleep test after 6/17 suffered from anxiety during the test.
- Steve anyway does not suffer from anxiety. For Angel and John, data was not reliable before either due to other reasons. So, status does not change.
3. [yes] All of the patients less than 50 years of age had atypical sleep the night before the test.
- This will change Ramesh and Steve's data from "not misleading" to "misleading".

Test: Data Insights - 3 - Question 15

From each drop-down menu, select the option that creates the most accurate statement based on the information provided.
1. The increase in the estimated year-end population of Territory C from 1990 to 2010 accounts for approximately _______ % of the increase in the estimated year-end population of Nation X over the same period.
2. In 2010, the estimated total year-end population of the 3 territories was _______ of the estimated year-end population of Nation X.

Detailed Solution for Test: Data Insights - 3 - Question 15

1. Measured in thousands, the estimated year-end population of Territory C was approximately 2,900 in 1990 and 4,600 in 2010, for an increase of approximately 4,600 − 2,900, or 1,700, over that period.
The total estimated year-end population of Nation X, in thousands, was 17,000 in 1990 and 22,500 in 2010, an increase of 22,500 − 17,000, or 5,500.
Thus, Territory C’s population increase represents 100 (1,700/5,500), or 30 10/11, percent of the total increase.
The correct answer is 30.

2. Measured in thousands, the 2010 estimated year-end population was approximately 7,250 for Territory A, approximately 5,600 for Territory B, and approximately 4,600 for Territory C, for a combined total of approximately 17,450.
The estimated total year-end population, in thousands, of Nation X for 2010 was 22,500. 
Thus, the estimated total of the three territories represents 100 (17,450/22,500), or 
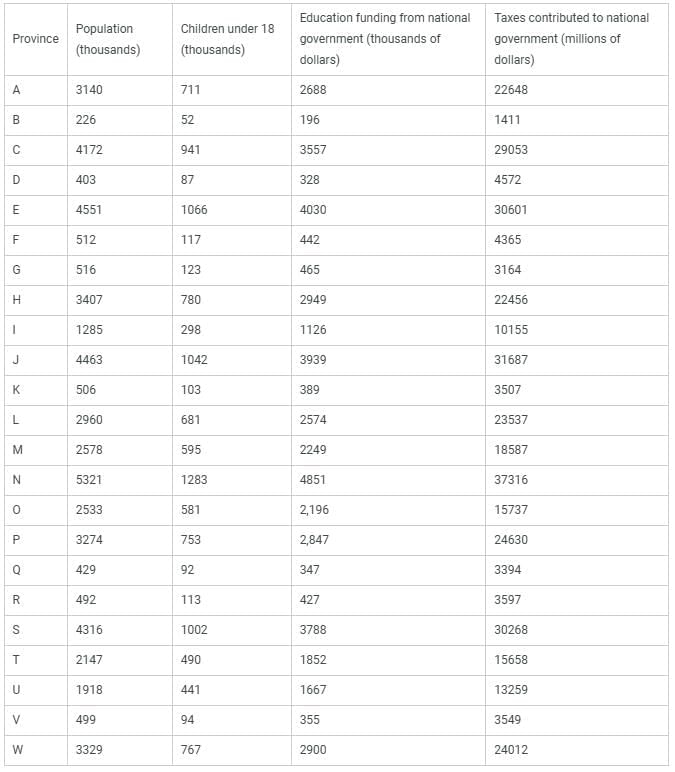
percent of the estimated year-end total population of Nation X in 2010.
The correct answer is between 70% and 80%.

Test: Data Insights - 3 - Question 16

Based on the information provided, select from each drop-down menu the option that creates the most accurate statement.
1. Of the five combination meals, the meal with entrée _____ has the highest price.
2. Of the five combination meals, the sale of a single meal with entrée ______ nets the least profit.

Detailed Solution for Test: Data Insights - 3 - Question 16

1: Since the extras always have the same cost to the restaurant, that cost must be lowest as a percentage of the highest price charged for a combination meal.
The graph shows the extras cost only about 15% of the price charged for the combination meal with entrée E1, but at least 20% of the price charged for each of the other combination meals. So, the combination meal with entrée E1 has the highest price.
The correct answer is E1.

2. Let's assume that apart from the costs shown in the graph, any other costs to the restaurant are the same for each combination meal served.
Out of the sales price of a combination meal, the percentage profits to the restaurant are then lower for combination meals whose total percentage costs shown in the graph are higher.
The total percentage costs shown in the graph are highest for the combination meal with entrée E4, so this meal must net the least profit as a percentage of its sales price.
Next, note that the graph shows that the extras cost at least as high a percentage of this meal's sales price as of any of the other combination meals' sales prices.
That means this meal must have a sales price no higher than any of the other combination meals do.
So, because the meal with entrée E4 nets the least profit as a percentage of its sales price, and that sales price is no higher than any other combination meal's sales price, the meal with entree E4 must net the least total amount prcfit per meal served.
The correct answer is E4.

Test: Data Insights - 3 - Question 17

For each of the following statistical measures, select Must be 20 or less for every level if, based on the information provided, the measure must be at most 20 for each of the 15 levels. Otherwise, select Could be greater than 20 for one or more.

Detailed Solution for Test: Data Insights - 3 - Question 17

1. Mean of the total number of attempts to complete for all testers who completed the level.

  • Check if any of the levels has more number of attempts in 15-20 and 20-25 attempts than the sum of all other columns.
  • When you scan the table, the level 14 stands out as there are 3 in 11-15 attempts , 2 in 16-20 attempts and 4 in 21-25 attempts.
  • So, the max mean would be when all the testers took the maximum attempt in each case, so 3 took 15 attempts, 2 took 20 attempts and 4 took 25 attempts.

    Could be greater than 20.

2. Median of the total number of attempts to complete for all testers who completed the level

  • Check if any of the levels has more number of attempts in 20-25 attempts than the sum of all other columns.
  • When you scan the table, no level has sum of numbers under 1-5, 6-10, 11-15 and 16-20 attempts less than that under 21-25.
  • Thus median will always be 20 or less......Equal to or less than 20

3. Range of the total number of attempts to complete for all testers who completed the level

  • If any level has been finished be some tester in 1-5 attempts while there are some more who have finished it in 20-25 attempts, the maximum range could be 25-1 = 24.
  • There are many under this case: Level 3, 4, 5, 7, 9-15
    Could be greater than 20­
Test: Data Insights - 3 - Question 18

For each of the following statements, select Yes if the statement is accurate, based on the information provided. Otherwise, select No.

Detailed Solution for Test: Data Insights - 3 - Question 18

Answering this question isn't particularly complicated. Basically, we just have to find a fastest time and find the biggest difference between the runners' first times and fastest times.
At the same time, getting this question correct can be a little tough because, when we sort the table, we can get the impression that we've found the value we need when actually we haven't.
So, one key move we need to make to get this question correct is to sort on each runner individually when we're looking for the runners' fastest times. If we fail to do that, we could get the impression that we're using a runner's fastest time when we're actually using another time.
Runner D will be awarded the $50 prize.
This statement is fairly straightforward to handle. The $50 prize will be awarded to the runner with "the overall fastest time (the fastest among all of the times in all of the runs)." So, we just have to find the single fastest time in the table and see whether that time belongs to Runner D.
To do so, we sort each runner's column individually from lowest to highest. Sorted, each column shows a runner's fastest time at the top since the lowest number is the runner's fastest time.
Here's what we find at the top of the runners' sorted columns:

  • Runner A: '39:01
  • Runner B: ‘38:02
  • Runner C: ‘37:29
  • Runner D: ‘37:56
  • Runner E: ‘38:11

We see that the lowest value of the five is Runner C's fastest time.
So, Runner C, rather than Runner D, will get the $50 prize.
Select No.

Runner A will be awarded the $30 prize.
To determine whether this statement is true, we'll compare each runner's first time with that runner's fastest time by sorting on Run # to bring up the runner's first time and then sorting on the individual runner to bring up the runner's fastest time.
Checking this statement takes a little more work, but once again, the key to getting this one right is being careful to sort the columns individually to compare each runner's first time with that runner's fastest time.
Also, we don't have to calculate exact differences between first times and fastest times. We can eliminate some runners quickly by estimating roughly and then be more exact if we have to with any that are close.
Finally, if we've read all the statements, we can see that, in checking this statement, we can also check the third statement since, to check the third statement, we have to determine which individual will get the $30 prize.
Here's what we get for the difference between the first and fastest time for each runner:

  • Runner A: ‘41:53 - '39:01 ≈ 42 - 39 ≈ 3
  • Runner B: ‘40:18 - ‘38:02 ≈ 2.25
  • Runner C: ‘41:26 - ‘37:29 ≈ 41.5 - 37.5 ≈ 4
  • Runner D: ‘41:33 - ‘37:56 ≈ 41.5 - 38 ≈ 3.5
  • Runner E: ‘41:25 - ‘38:11 ≈ 41.5 - 38.25 ≈ 3.25

We see the Runner C has the biggest difference, and we could have stopped checking at Runner C for this statement, but we needed to check Runner D and Runner E to check the next statement. So, if we've already read the next statement, we can get two statements done together by checking all the runners at once.
In any case, we see that Runner C rather than Runner A improved the most.
Select No.

Both prizes will be awarded to the same individual.
In checking the above two statements, we've found that Runner C had the fastest time and improved the most.
If we hadn't calculated improvements for Runner D and Runner E when we checked the previous statement, we could have done it now to confirm that Runner C improved the most.
In any case, it's true that both prizes will be awarded to the same individual, Runner C.
Select Yes.

Test: Data Insights - 3 - Question 19

a, b, k, s are different non-zero integers, 2/a + 4/b = k/s and k/s is maximally reduced. Does s = ab?

1. a and b are primes
2. a and b have gcd = 1

Detailed Solution for Test: Data Insights - 3 - Question 19


Since k/s in its simplest form, s must be the denominator in its irreducible form, which is ab/gcd(2b + 4a,ab).

Statement 1: If a and b are primes, their product ab has no common factors with 2a + 4b (except possibly 2, but that won't affect the full fraction’s reducibility). Hence, s = ab.

Statement 2: If gcd (a, b) = 1, the same reasoning applies, as gcd(2b + 4a, ab) will still be 1. Thus, s = ab.
Since each statement alone guarantees the answer, the correct choice is D.

Test: Data Insights - 3 - Question 20

Each type A machine fills 400 cans per minute,each Type B machine fills 600 cans per minute,and each Type C machine installs 2,400 lids per minute.A lid is installed on each can that is filled and on no can that is not filled.For a particular minute,what is the total number of machines working?

(1) A total of 4,800 cans are filled that minute
(2) For that minute,there are 2 Type B machines working for every Type C machine working

Detailed Solution for Test: Data Insights - 3 - Question 20

We are given that each Type A machine fills 400 cans per minute, each Type B machine fills 600 cans per minute, and each Type C machine installs 2,400 lids per minute.

We need to determine the total number of machines working for a particular minute. If we let a = the number of Type A machines needed, b = the number of Type B machines needed, and c = the number of Type C machines needed, we need to determine the value of a + b + c.

Statement One Alone:

A total of 4,800 cans are filled that minute.

Since a Type C machine installs 2,400 lids per minute, we know that we need 2 Type C machines (i.e., c = 2) to install 4,800 lids after the 4,800 cans are filled in that minute.

Since each Type A machine fills 400 cans per minute and each Type B machine fills 600 cans per minute, we have:

400a + 600b = 4,800

4a + 6b = 48

2a + 3b = 24

However, since we only have one equation but we have two variables, the values of a and b are not unique. For example, a = 12 and b = 0 OR a = 0 and b = 8.

Statement one alone is not sufficient to answer the question.

Statement Two Alone:

For that minute, there are 2 Type B machines working for every Type C machine working.\

Thus, b/c = 2/1, i.e., b = 2c; however we still cannot determine a + b + c. Statement two alone is not sufficient.

Statements One and Two Together:

From statement one, we know that c = 2 and 2a + 3b = 24, and from statement two, we know that b = 2c. Since c = 2 and b = 2c, we see that b = 4.

Next we can substitute 4 for b in the equation 2a + 3b = 24:
2a + 3(4) = 24
2a + 12 = 24
2a = 12
a = 6
Thus a + b + c = 6 + 4 + 2 = 12. We need 12 machines for that particular minute.

18 docs|33 tests
Information about Test: Data Insights - 3 Page
In this test you can find the Exam questions for Test: Data Insights - 3 solved & explained in the simplest way possible. Besides giving Questions and answers for Test: Data Insights - 3, EduRev gives you an ample number of Online tests for practice
Download as PDF