GMAT Exam  >  GMAT Tests  >  GMAT Mock Test Series 2025  >  Test: Data Insights - 7 - GMAT MCQ

Test: Data Insights - 7 - GMAT MCQ


Test Description

20 Questions MCQ Test GMAT Mock Test Series 2025 - Test: Data Insights - 7

Test: Data Insights - 7 for GMAT 2025 is part of GMAT Mock Test Series 2025 preparation. The Test: Data Insights - 7 questions and answers have been prepared according to the GMAT exam syllabus.The Test: Data Insights - 7 MCQs are made for GMAT 2025 Exam. Find important definitions, questions, notes, meanings, examples, exercises, MCQs and online tests for Test: Data Insights - 7 below.
Solutions of Test: Data Insights - 7 questions in English are available as part of our GMAT Mock Test Series 2025 for GMAT & Test: Data Insights - 7 solutions in Hindi for GMAT Mock Test Series 2025 course. Download more important topics, notes, lectures and mock test series for GMAT Exam by signing up for free. Attempt Test: Data Insights - 7 | 20 questions in 45 minutes | Mock test for GMAT preparation | Free important questions MCQ to study GMAT Mock Test Series 2025 for GMAT Exam | Download free PDF with solutions
Test: Data Insights - 7 - Question 1

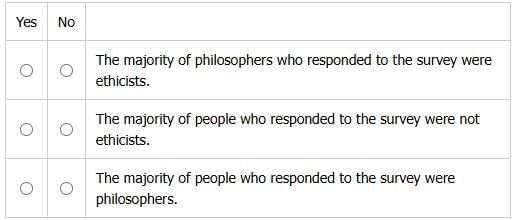
For each of the following statements about the respondents to the survey, choose from the given options.

Test: Data Insights - 7 - Question 2

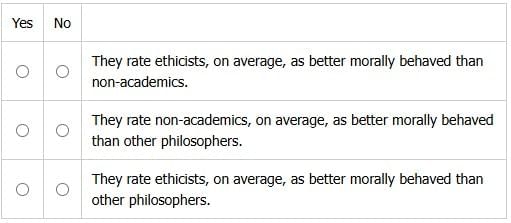
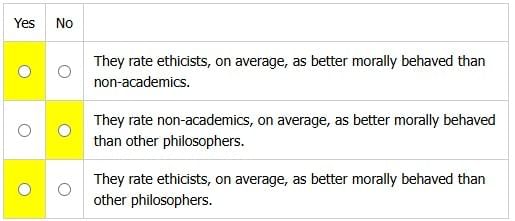
For each of the following statements about the ethicists surveyed, choose from the given options.

Detailed Solution for Test: Data Insights - 7 - Question 2

Test: Data Insights - 7 - Question 3

Of the following questions, which one is NOT answerable using only the information provided?, choose from the given options.

Test: Data Insights - 7 - Question 4

­Biologist: Conservation biologists working to prevent species extinction have long acknowledged that popular species such as lions, eagles, and pandas receive disproportionately large amounts of funding and public attention as compared to less-popular species such as invertebrates and amphibians. Indeed, many of these less-popular species are more in danger of extinction than the more popular species. Although many conservation biologists have accepted this pattern of disproportionate funding, I believe it needs to stop. For, despite the substantial and continuing expenditure of resources on the more-popular species, very few of these species have any chance of escaping extinction.

The biologist's reasoning is subject to the criticism that the claim that ____A____, which is used to justify the main point, undermines the support for the point that ____B____.

Select for A and for B the options such that criticism of the zoologist's reasoning is strongest. Make only two selections, one in each column. 

Test: Data Insights - 7 - Question 5

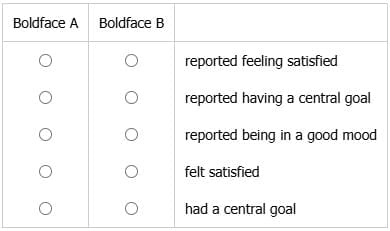
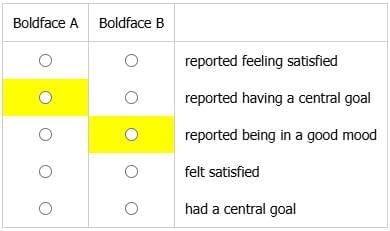
The following argument is logically flawed. The author's goal was to craft the argument so that the conclusion follows logically from Premises 1 and 2 and so that both premises are necessary to draw the conclusion.

Premise 1: Every respondent to our survey who reported feeling satisfied also reported being in a good mood.
Premise 2: Every respondent to our survey who reported having a central goal also reported being in a good mood.
Conclusion: Therefore, assuming all of the reports were accurate and complete, every respondent to our survey who felt satisfied also had a central goal.

Choose for Boldface A and for Boldface B two of the boldface phrases in the argument such that Boldface A occurs earlier in the argument than Boldface B, and exchanging the positions of those two phrases in the argument would make it so the argument fulfills the author's goal. ­

Detailed Solution for Test: Data Insights - 7 - Question 5

These are conditional Statements. Every/Whenever etc signal 'if' conditional statements.

Important: The author's goal was to craft the argument so that the conclusion follows logically from Premises 1 and 2 and so that both premises are necessary to draw the conclusion.
The argument as given is certainly flawed. How will it follow logically? (i.e. deductive logic) Identify that "conclusion follows logically" means that we should be able to deduce the conclusion.

Premises:
If A, then B.
If B, then C
Conclusion: Hence if A then C.

A, B, C are "satisfied," "goal" and "mood" in some order.
The "reported good mood" phrasing is available twice so make it 'B' in our if then conditional shown above.
If satisfied, then good mood.
If good mood, then central goal.
Conclusion: Hence if satisfied, then central goal.
Fits. So exchange "reported having a central goal " with "reported being in a good mood" (ANSWER)

Test: Data Insights - 7 - Question 6

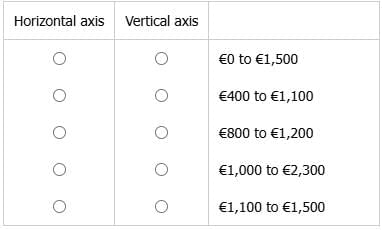
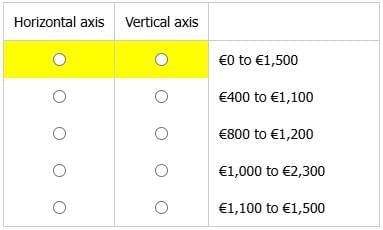
Throughout a certain decade in a European city, the mean monthly rents for studio apartments varied yearly, from a low of €804 to a high of €1,173. Those for one-bedroom apartments also varied yearly, from a low of €1,060 to a high of €1,497. But some individual studio apartments rented for as little as €420 in some years, and some one-bedroom apartments rented for up to €2,262. To visually assess how the ratio of mean monthly rents for studio apartments to those for one-bedroom apartments varied yearly over the decade, Maria requires a graph with the following characteristics. The graph will have two axes of equal length, with mean rents for one-bedroom apartments shown on the horizontal axis and mean rents for studio apartments shown on the vertical axis, and with the same scale on both axes. For each year, mean rents will be plotted as a point.
From the following options, select for Horizontal axis a range for the points on the horizontal axis and select for Vertical axis a range for the points on the vertical axis that together would satisfy Maria's requirements for the graph. Make only two selections, one in each column.­

Detailed Solution for Test: Data Insights - 7 - Question 6

The graph must have the following characteristics:

  • two axes of equal length
  • mean rents for one-bedroom apartments shown on the horizontal axis
  • mean rents for studio apartments shown on the vertical axis
  • the same scale on both axes
  • For each year, mean rents will be plotted as a point.

The passage provides several values. However, the graph will show only mean rents. So, the only values that matter are the following:

Studio apartments:
a low of €804 to a high of €1,173   

One-bedroom apartments:
a low of €1,060 to a high of €1,497

So, the axis for studio apartments must go at least from around 800 to around 1,200, and the axis for one-bedroom aparments must go at least from around 1,000 to around 1500.

  • €0 to €1,500
  • €400 to €1,100
  • €800 to €1,200
  • €1,000 to €2,300
  • €1,100 to €1,500

One of the characteristics of the graph is that it has two axes of equal length. Scanning the choices, we see that only two are of the same length: €800 to €1,200 and €1,100 to €1,500.
€800 to €1,200 would work for studio apartments since it allows for a low of €804 and a high of €1,173.
However, €1,100 to €1,500 does not work for one-bedroom apartments since it does not allow for the low of €1,060.
So, it must be the case that one of the choices works for both axes since only by using one choice for both can we get axes of equal length and include all the values.
(Also, by the way, if one choice works for both, that choice must be the correct answer since the question cannot be answerable in two ways.)
To have the points for all the values of mean rents, the axes must go at least from a low of around 800 to a high of around 1,500. The only choice that includes both of those values is €0 to €1,500.
So, the correct answer for both Horizontal axis and Vertical axis is €0 to €1,500.
Answer: €0 to €1,500, €0 to €1,500­­

Test: Data Insights - 7 - Question 7

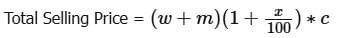
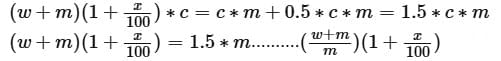
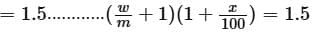
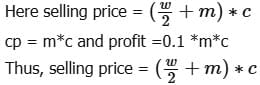
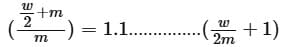
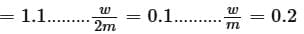
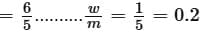
A milk vendor mixes water with milk and sells the mixture at the same price per liter as if it were undiluted milk. The selling price per liter of the mixture is the vendor’s cost per liter of the milk plus a markup of x %. The water costs the vendor nothing. If the vendor gets a 50% profit on the sale of the mixture, what is the value of x ?

(1) If the vendor mixes half the intended quantity of water and sells every liter of the mixture at the cost price per liter of the undiluted milk, the vendor will get a 10% profit.
(2) The concentration of milk in the mixture after adding water is 5/6.­

Detailed Solution for Test: Data Insights - 7 - Question 7

­Let the mixture contain w litres of water and m litres of milk. Also, let the cost price of milk be c.


Total cp = c * m
Profit = 0.5 *c * m
Thus, Total Selling Price = Total cp + profit => 

If we know the value of w/m, we can find x

(1) If the vendor mixes half the intended quantity of water and sells every liter of the mixture at the cost price per liter of the undiluted milk, the vendor will get a 10% profit.

Sufficient

(2) The concentration of milk in the mixture after adding water is 5/6.­

Thus


Sufficient

Test: Data Insights - 7 - Question 8

­In a spelling competition, competitors were required to spell 108 different words. How many of these words contained the letter T but did not contain the letter U?

(1) Every word that contained the letter Q also contained the letter U, and every word that did not contain the letter Q did contain the letter T.
(2) 1/3 of the words contained the letter U.­

Detailed Solution for Test: Data Insights - 7 - Question 8

(1) Every word that contained the letter Q also contained the letter U, and every word that did not contain the letter Q did contain the letter T.

If we only knew the number of words with the letter Q we could answer the question. But we don't.
INSUFF.

(2) 1/3 of the words contained the letter U.­
Thus 2/3 of 108 or 73 words did not contain U. But we know nothing of T.
INSUFF.

Combined (1 + 2)
Total words = words with Q + words without Q 
Words with Q = Words with U = 36 ...from statement (2)
Words without Q and U = 108 -36 = 72 → Contained T
SUFF.

Correct Answer: C

Test: Data Insights - 7 - Question 9

Rounded to the nearest 10,000, the populations of San Pepe and of its suburb Maple Beach are 140,000 and 80,000, respectively. What is the combined population of San Pepe and Maple Beach, rounded to the nearest 10,000 ?

(1) The exact population figures of San Pepe and Maple Beach are each within 2% of the rounded figures above.
(2) The approximate population figure for San Pepe was rounded up, whereas the figure for Maple Beach was rounded down.

Detailed Solution for Test: Data Insights - 7 - Question 9

Given:
135 < SP < 145
75 < MB < 85

Thus:
210 < SP + MB < 230

So, SP + MB, rounded to the nearest 10, could be 210, 220, or 230.
(1) The exact population figures of San Pepe and Maple Beach are each within 2% of the rounded figures above.
Since SP rounded to the nearest 10 is 140, its exact population is approximately from 137 (a little more than that) to 143 (a little less than that) (2% of 140 is less than 3).
Since MB rounded to the nearest 10 is 80, its exact population is approximately from 78 (a little more than that) to 82 (a little less than that) (2% of 80 is less than 2).
Thus:
137 + 78 < SP + MB < 143 + 82
215 < SP + MB < 225
Rounded to the nearest 10, the combined population is 220. Sufficient.

(2) The approximate population figure for San Pepe was rounded up, whereas the figure for Maple Beach was rounded down.
135 < SP < 140
80 < MB < 85
Thus:
215 < SP + MB < 225
Rounded to the nearest 10, the combined population is 220. Sufficient.

Correct Answer: D.

Test: Data Insights - 7 - Question 10

­Of the 115 members at the Shady Hills Country Club, some play only tennis, some play only golf, some play only lawn bowling, some play tennis and golf, some play tennis and lawn bowling, some play golf and lawn bowling, and 10 members play all 3. How many members play tennis?

(1) The number of members who play tennis and lawn bowling is 3 times the number of members who play tennis and golf and the total number of members who play golf or lawn bowling is 90.
(2) 40 members play only golf and 10 members play only lawn bowling.

Detailed Solution for Test: Data Insights - 7 - Question 10

We need t = z + x + y + 10 or we need the value of x + y + z
(1) The number of members who play tennis and lawn bowling is 3 times the number of members who play tennis and golf and the total number of members who play golf or lawn bowling is 90.
Please refer to the fig. above:
Tennis and bowling is 3 times Tennis and golf
y + 10 = 3(x + 10) ..(i)
Total number of members who play golf or lawn bowling is 90
(p + x + 10 + q) + (y + 10 + q + r) - (10 + q) = 90 .... (A or B = A + B - Both)
p + x + 10 + q + y + r = 90 ..(ii)
(z + x + 10 + y) + p + q + r = 115 ...(iii)
Using (ii) (iii) we can get z but we still cannot get x + y.
INSUFF.
(2) 40 members play only golf and 10 members play only lawn bowling.


So p = 40 and r = 10
Clearly using stem and this statement we still cannot get x + y + z.
INSUFF.

Combined (1+2)
Using both the statements and the three equations (i) (ii) and (iii) we still cannot get x + y
INSUFF.

Correct Answer:  E

Test: Data Insights - 7 - Question 11

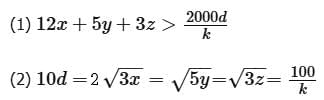
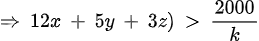
­A juice company is creating a new fruit punch that is 60% orange juice, 25% grape juice, and 15% apple juice by weight. If the cost for the company is x cents per kg for orange juice, y cents per kg for grape juice, and z cents per kg for apple juice, is the cost of k kg of the fruit punch more than d dollars?

Detailed Solution for Test: Data Insights - 7 - Question 11

From the passage­ what we need to prove is -
k (60%x + 25%y + 15%z) > 100d .............. (i) ; [100d is to convert the do dollars into cents]

STATEMENT 1:
We can try whether the equation above can be used to prove the equation of statement 1. Multiply the above equation by 20. [I divided each term of statement 1 with each equivalent term of the equation we made above to find out that all of them have a common divisor of 20]

Now the above equation lands on,
k(12x + 5y + 3z) > 2000d

STATEMENT 2:
If all of them are squared statement 2 lands like -
100d2 = 12x  = 5y = 3z = 10000/k2

equation (i) stands like -
k(1000d2 + 100d2 + 100d2); [as 100d2 = 12x = 5y = 3z]

= 3000d ; which is greater than 100d [from equation (i)]

Answer: D

Test: Data Insights - 7 - Question 12

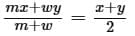
­In a company, the average (arithmetic mean) salary of all employees equals the average of the average (arithmetic mean) salary of the men and the average (arithmetic mean) salary of the women. If the sum of the average salaries of the men and the women is $88,000, what is the average salary of the men in the company?

(1) The number of men in the company is greater than the number of women.
(2) The average salary of the men is equal to the average salary of the women in the company.­

Detailed Solution for Test: Data Insights - 7 - Question 12

Generally, in a weighted average problem like this one, the average salary of the combined group will always be closer to the average of the larger group. For instance, if the average salary of men is $50,000 and that of women is $60,000, and there are more men than women, the overall average salary will be closer to $50,000 than $60,000. This means it will be less than $55,000, ranging from $50,000 to just below $55,000. However, the question states that the overall average salary equals the midpoint between the average salaries of men and women. This scenario can only occur if either the numbers of men and women are equal, or the average salaries of men and women are the same.

Expressed algebraically, assuming there are m men and w women, with average salaries of x and y respectively, the overall average salary can be calculated as (mx + wy)/(m + w). We are told that this equals (x + y)/2. For, (mx + wy)/(m + w) = (x + y)/2 to hold, either m = w or x = y must be true:

2mx + 2wy = mx + my + wx + wy
mx + wy = my + wx
mx - wx = my - wy
x(m - w) = y(m - w)
x(m - w) - y(m - w) = 0
(m - w)(x - y) = 0

Either m = w or x = y.
(1) The number of men in the company is greater than the number of women.
This statement implies that the number of men and women are different, hence, it must be true that their average salaries are the same. Thus, the average salary of the men equals $88,000/2 = $44,000. Sufficient.

(2) The average salary of the men is equal to the average salary of the women in the company.
Given that the average salaries are equal, and the sum of the average salaries is $88,000, then the average salary of the men equals $88,000/2 = $44,000. Sufficient.

Answer: D.­

Test: Data Insights - 7 - Question 13

­It has been proposed that teenagers aged 10 to 15 years be restricted to less than 2 hours per day engaging with social media. Would a significant number of teens aged 10 to 15 years get an overall developmental or health benefit from such a restriction?

(1) A peer-reviewed study indicates a 23% increase in the incidence of chronic anxiety or depression among teenagers aged 10 to 15 years who average 2 or more hours per day engaging with social media.
(2) Certain kinds of engagement with social media averaging 2 or more hours per day by teenagers aged 10 to 15 years lead, in about 28% of cases, to meaningful friendships and social and emotional learning, both of which are valuable for development at those ages.

Detailed Solution for Test: Data Insights - 7 - Question 13

(1) This statement cites a study that found an association between social-media use by teenagers 10 to 15 years and an increase in the incidence of chronic anxiety or depression among 23% of the minors observed in the study. A key word here is association: It should be noted that this does not prove a cause-effect relationship, even if the study could motivate further investigation to see whether a causal mechanism could be identified. Even if a causal mechanism were identified, it could turn out that the use of social media was at least in part an effect of chronic anxiety or depression: Some teenagers might resort to social media use as a kind of escape mechanism. We should conclude that the information provided (even if the validity of the study is assumed) does not provide sufficient information to show definitively that the proposed restriction would result in developmental or health benefits for minors aged 10 to 15 years. The conclusion is that (1) is not sufficient alone; NOT sufficient.

(2) This statement indicates that use of social media by teens aged 10 to 15 years results in significant developmental benefits for 28% of teens in that age group. In other words, it indicates that social-media use by these teens causally contributes to a developmentally valuable effect. This implies that restriction of their social media use risks depriving a significant number of teens of the benefits resulting from their social-media use. So we can conclude that (2) is sufficient alone to provide a negative answer to the question posed; SUFFICIENT.

The correct answer is B; statement 2 alone is sufficient.

Test: Data Insights - 7 - Question 14

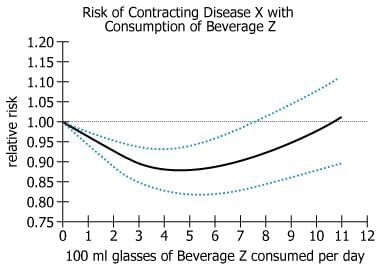
Based on a study of a 10,000 person sample of the adult population of Country Y, the unbroken curve on the graph plots an association between daily consumption of various amounts of Beverage Z and the relative risk of contracting Disease X compared to the risk with no consumption of Beverage Z (indicated by 1.00). For the entire adult population of Country Y, the relative-risk values could—because of sampling error—be either higher or lower than for the particular 10,000 person sample studied. Thus the two broken lines show the estimates of how high or how low those relative-risk values for that population could be.­
Choose the options that create the statement that is most strongly supported by the information provided.
Compared to the risk with no consumption of Beverage Z, the reduction in relative risk of contracting Disease X for adults of Country Y is ____(A)_____ when the daily consumption of Beverage Z is in the range of ____(B)_____ 100 mg glasses.

Detailed Solution for Test: Data Insights - 7 - Question 14

The question talks of comparison on relative risk with no consumption of a beverage and some consuption of the beverage, so we are dealing with the straight line vs the curved line.

The first blank talks of this relation and the options are:
Unchanged: For unchanged, the two lines, straight and curved, should be superimposed on each other. But that is not the situation anywhere on the line graph. Discard. (Although the lines intersect at a certain time, but the second blank talks of range of number of glasses).
Least: Least reduction will be when the two lines are close to each other.
Greatest: Greatest reduction will be when the curved line is the farthest from staright line

Let us now, relate least and greatest with second blank.
1-3: It is not the lowest or greatest as the curved line is sloping downwards ( moves from 0.97 to 0.90), so reduction is neither the least nor the greatest.
4-6: The curved line flattens at this location and is at the lowest point 0.90-0.92, so the reduction is the greatest in this range.
7-8: The curved line moves upwards from 0.93 to 0.95, thus neither the least nor the greatest.

Correct combination:
1. Greatest
2. 4-6­

Test: Data Insights - 7 - Question 15

For each of six archaeological excavation sites, the table shows whether pottery, jewelry, or statuettes were found at that site.

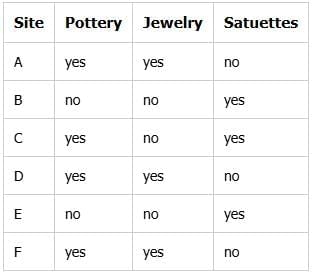
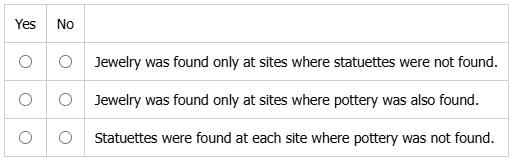
For each of the following statements about the sites in the table, choose the options if the statement is accurate based on the information provided.

Detailed Solution for Test: Data Insights - 7 - Question 15

1. Jewelry was found only at sites where statuettes were not found.
Sort the table as per 'Jewelery'.
Check if every site that had yes for Jewelery had a no for statuettes.
A, D and F have a yes for jewelery and each of them has a no for statuettes.
So, YES

2. Jewelry was found only at sites where pottery was also found.
Sort the table as per 'Jewelery' again.
Check if every site that had yes for Jewelery had a yes for pottery.
A, D and F have a yes for jewelery and each of them has a yes for pottery.
So, YES
Does not matter that C has a yes for pottery but a no for jewelery, because we are concerned with only the opposite, that is there should be no site of jewelery where pottery was not found.

3. Statuettes were found at each site where pottery was not found.
Sort the table as per 'Pottery'.
Check if every site that had no for pottery had a yes for satuettes.
B and E have a no for pottery and each of them has a yes for satuettes.
So, YES
Does not matter what happens at sites where pottery was found. We are concerned only with sites that did not have pottery, and those are B and E.

Test: Data Insights - 7 - Question 16

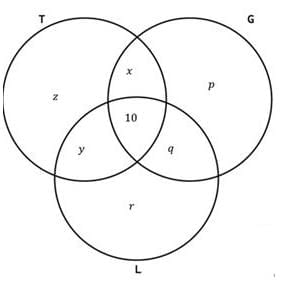
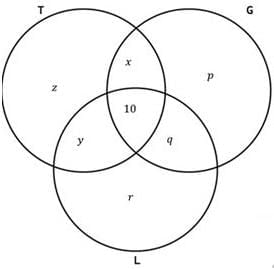
Two students are discussing three themes from One Hundred Years of Solitude by Gabriel García Márquez.
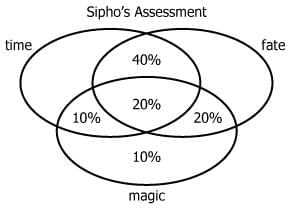
Sipho maintains that every portion of the novel addresses at least one of the themes of time, fate, or magic, but that only 20% of the novel addresses all three themes and that 10% addresses magic only (among these three themes). Further details of his assessment are provided in the Venn diagram.
Anika agrees with much of Sipho's assessment. In particular, for any portion of the novel that, according to Sipho's assessment, addresses the theme of time, Anika agrees that the portion indeed addresses the theme of time. Likewise for the themes of fate and magic. However, contrary to Sipho's assessment, Anika maintains that every portion of the novel that addresses the theme of magic also addresses the theme of fate.
Choose from the options that creates a statement that is consistent with the information provided.

Anika maintains that   ____(A)____ % of the novel that addresses the theme of time also addresses the theme of fate.
Anika maintains that ____(B)____ % of the novel addresses the theme of magic.

Detailed Solution for Test: Data Insights - 7 - Question 16

Sipho's assessment:
Only M = 10%
Only (M&T) = 10%
Only (T&F) = 40%
Only (M&F) = 20%
T&F&M = 20%

Anika agrees that the portion indeed addresses the theme of time. Likewise for the themes of fate and magic.
So, Anika agrees that whatever is under each of the theme remains under the same theme.
Time - 70%, Fate - 80% and Magic - 60%

However, contrary to Sipho's assessment, Anika maintains that every portion of the novel that addresses the theme of magic also addresses the theme of fate.
The 60% under theme of magic is also under time.
So, 10%(only(T&M)) moves under fate theme too, so adds on to T&F&M to increase it from 20% to 30%.
Also, 10%(Only(M)) moves under fate theme too, so adds on to F&M to increase it from 20% to 30%.

­Anika maintains that x% of the novel that addresses the theme of time also addresses the theme of fate.
As we can see now that entire 100% has moved under FATE, so surely 100% of theme of time has also moved under FATE.  x = 100%

Anika maintains that y% of the novel addresses the theme of magic.­­  
There is no shift inwards or outwards from the Magic theme. Only it moves under fate too. so y remains at 60%.

Test: Data Insights - 7 - Question 17

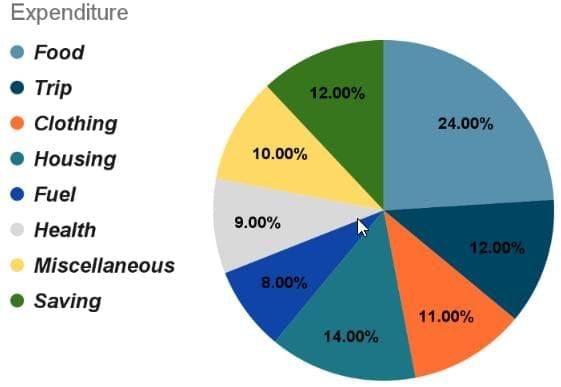
The graph above shows the percentage of yearly income of the Samuel family spent under various heads. That is, 24% of the income is spent on food, while 10% is spent on all other activities not listed and placed under miscellaneous expenditure.
Choose the option that creates the most accurate statement based on the graph above.
|If the expenditure on clothing exceeds expenditure on fuel by $2,400, then the total expenditure (including Saving) done by Samuel family is  ____(A)____

If Samuels were able to save 10% of the expenditure on food, the increase in savings would be ____(B)____

Detailed Solution for Test: Data Insights - 7 - Question 17

Let the total expenditure done by Samuel family be $x
11%x - 8%x = 2400
3%x = 2400;
x = 2400/3% = 240000/3 = $80000
The total expenditure done by Samuel family = $80000

If Samuels were able to save 10% of the expenditure on food, the increase in savings would be 20%
10% of the expenditure on food = 10% * 24% = 2.4%
The increase in savings = 2.4% / 12% = 20%

Test: Data Insights - 7 - Question 18

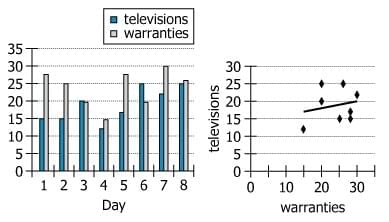
For a certain electronics retailer during each of eight days, both of the graphs show the number of televisions sold and the number of extended warranties sold (whether for televisions or for any other products sold at the store). The scatterplot also includes a trendline that shows the correlation between the daily numbers of televisions and warranties sold.
Choose the options that complete the statement so that it is accurate based on the information provided.
Among the days represented in the graphs, without the data for Day ____(A)____  , the daily numbers of televisions and extended warranties sold would _______(B)_______.

Test: Data Insights - 7 - Question 19

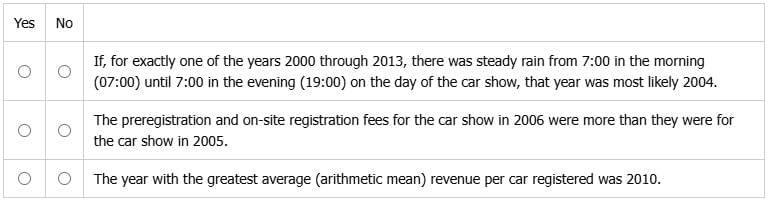
The table gives information about the annual car show that a certain antique car club held in an open field on the second Saturday in May each of the years 2000 through 2013. Each car show started at 9:00 in the morning (09:00) and ended at 3:00 in the afternoon (15:00). The club charged a fixed fee for registering a car in the show—one fee per car. Cars could be preregistered prior to the day of the show or registered on-site on the day of the show. Although the fee for preregistering a car was less than the fee for registering a car on-site, some people chose not to preregister their cars because preregistration fees were not refundable and they knew they would not attend the show if rain was forecasted.
For the first n car shows, where n is a positive integer less than 10, the fees were $10 for preregistering a car and $12 for registering a car on-site. For the remaining car shows, the fees for preregistering a car and for registering a car on-site were more than $10 and $12, respectively.

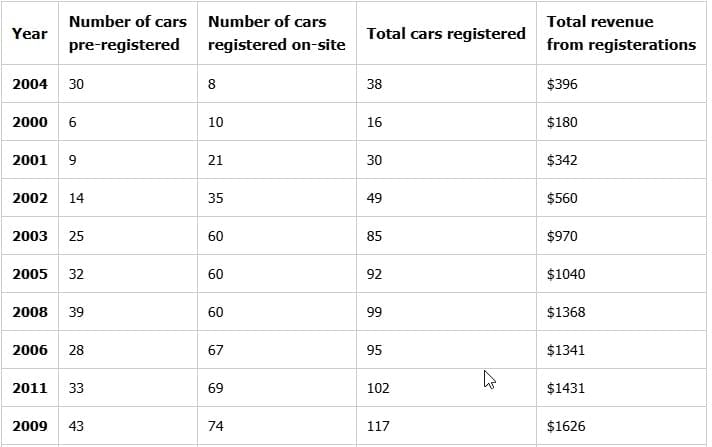
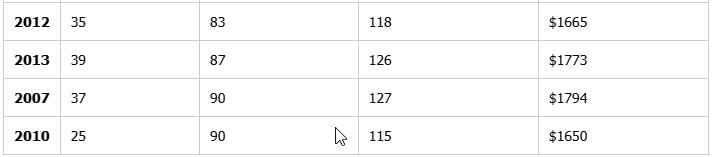
For each statement, select Yes if it can be determined from the information provided that the statement is true. Otherwise, select No.

Test: Data Insights - 7 - Question 20

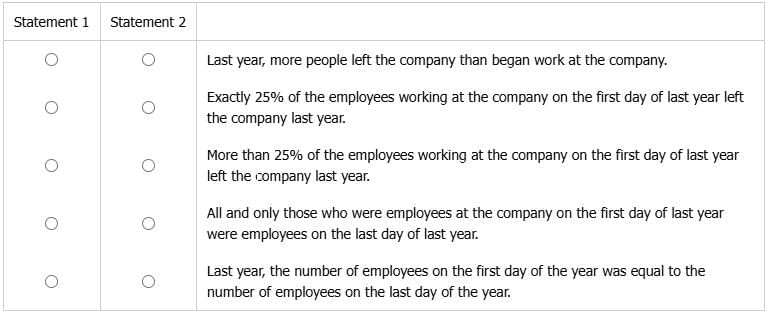
A certain company defines its annual labor turnover rate as the number of employees who left the company during the year divided by the average of the number of employees on the first day of the year and the number of employees on the last day of that year. Last year, the company had a labor turnover rate of exactly 25%.

Assuming that the information above is true, select for Statement 1 and for Statement 2 the statements such that if Statement 1 is true, then Statement 2 must be true, but it could be the case that Statement 2 is true and Statement 1 is false. Make only two selections, one in each column.­

18 docs|33 tests
Information about Test: Data Insights - 7 Page
In this test you can find the Exam questions for Test: Data Insights - 7 solved & explained in the simplest way possible. Besides giving Questions and answers for Test: Data Insights - 7, EduRev gives you an ample number of Online tests for practice
Download as PDF