Test: Data Insights - 4 - GMAT MCQ
20 Questions MCQ Test GMAT Mock Test Series 2025 - Test: Data Insights - 4

At a certain factory, the number of first-shift workers is 2/3 the number of second-shift workers. Every day, each second-shift worker can make 4/3 as many light bulbs as each first-shift worker.
In the first column, identify a possible number of total light bulbs made on one day by the two shifts combined; in the second column, identify the corresponding number of total light bulbs that the first-shift workers made on the same day. Make only two selections, one in each column.
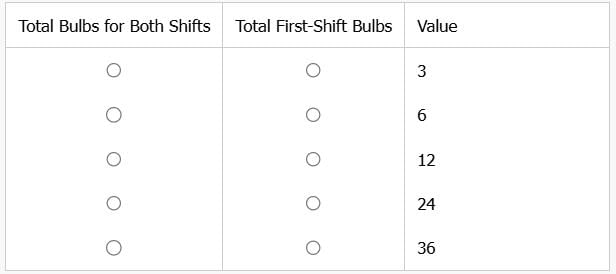
In the first column, identify a possible number of total light bulbs made on one day by the two shifts combined; in the second column, identify the corresponding number of total light bulbs that the first-shift workers made on the same day. Make only two selections, one in each column.
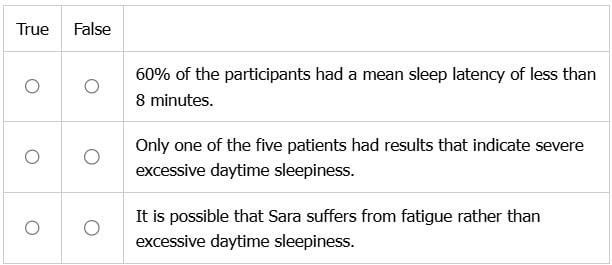
For the following statements, select True if the statement is inferable from the data provided. Otherwise select False.


The figure shows the current capability and management need for several species of threatened and endangered species.
1. According to the figure,_______ would be the most likely needlessly managed species, but it would be equally possible to manage the population of _________ and meet a much greater management need.
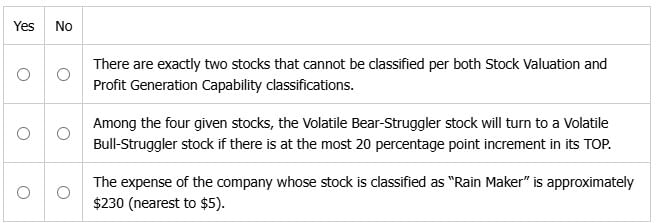
For each of the following statements, select Yes if the statement is true based on the information in the table. Otherwise, select No.

The operation denoted by the symbol # is defined for all real numbers p and r as p#r equals the larger of p and r. For example, 5#3 = 5. Which one of the distinct numbers x, y and z is the largest?
(1) (x#y)#z = x#z
(2) (x#z)#y = z#y
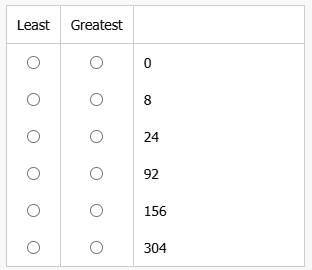
The 400 students at Watermelon Sugar High School can choose up to 3 electives from the following classes: an art class, a business class, and a computer class. Half of the students chose the art class, half of the students chose the business class, and half of the students chose the computer class.
If 96 of the students have signed up for all three electives, select from the available options the least possible and greatest possible number of students who could have signed up for exactly two of the three electives. Make only two selections, one in each column.
For each of the following statements, select yes if, based on the given information, it must be true, otherwise select no.
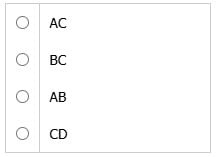
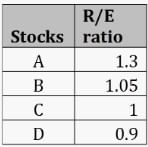
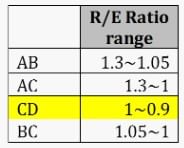
Select the company pair below whose combined revenue to combined expense ratio is the least?
Fill each blank using the drop-down menu to create the most accurate statement on the basis of the information provided.
1. The number of households in the Midwest that do not use electricity for heating is approximately ______ of the number of households in the US that use electricity for heating.
2. In the Midwest region, the average number of households using either propane/LPG or natural gas for heating is approximately _____ million per state.
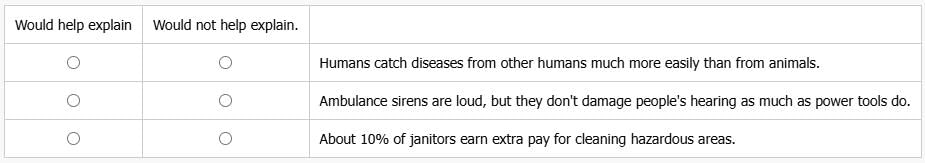
For each of the following statements, select Would help explain if it would, if true, help explain some of the information in the table. Otherwise, select Would not help explain.
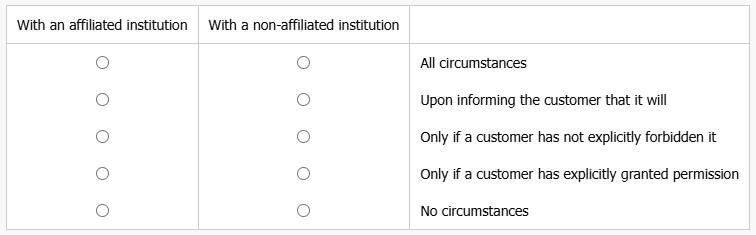
The government of Nation X restricts how banks share customers' information with other institutions. For instance, unless a customer explicitly grants permission, no nonpublic information about the customer—e.g., account balances or credit history—can be shared with any non-affiliated institution. Furthermore, banks must allow customers to forbid the sharing of even publicly available information about them, such as listed telephone numbers, with non-affiliated institutions. The bank must honor any decision the customer makes in these cases; however, none of these restrictions limits the sharing of these types of information with any affiliated institutions. All sharing of information other than the types mentioned above is permitted—except that under no circumstances may customers' passwords be shared, even with affiliated institutions. The government of Nation X also requires that banks inform customers of all of these policies.
Select for With an affiliated institution the circumstances under which the government of Nation X allows a bank to share a customer's account balance with an affiliated institution and for With a non-affiliated institution the circumstances under which the government of Nation X allows a bank to share a customer's account balance with a non-affiliated institution. Make only two selections, one in each column.
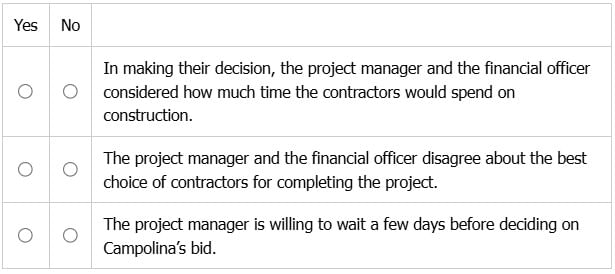
Consider each of the following statements. Does the information in the three emails support the inferences as stated? Choose Yes if the statement can be accurately inferred; otherwise, choose No.
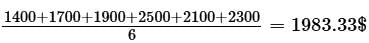
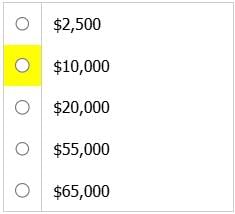
The amount of money lost each day that construction is delayed is closest to
For each of the following, use the drop-down menu to create the most accurate statement on the basis of the chart:
3. Approximately ______ percent of 8th graders in 2017 participated in exactly one of the six after-school activities.
4. In 2017 there ______ in which more students participated in sport activities than non-sport activities.
I. Assuming that the airline has the option to suspend up to three routes in order to mitigate the financial losses, it would be preferable to suspend the routes. _________
II. The ratio of the revenue of the most costly route to the least costly route is _________.
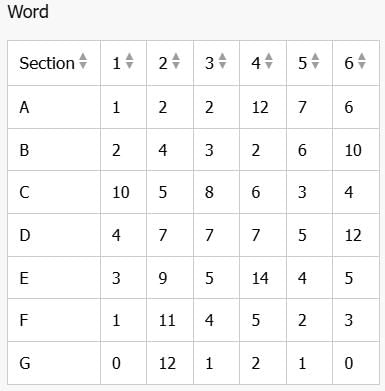
A text written in an unknown language was recently discovered and then digitized and analyzed. The analysts divided the text into 7 sections- Sections A through G—and computed word frequencies by section for each word in the text. The table shows these frequencies for Words 1 through 6. For instance, the table shows that Word 1 appeared 1 time in Section A, and 10 times in Section C.
The analysts consider two words to be correlational if their frequencies in the 7 sections of the text were positively correlated.
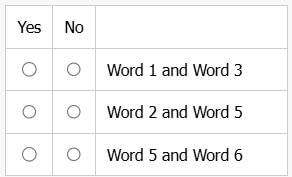
For each of the following pairs of words, select Yes if the information provided suggests that the analysts would consider the two words correlational. Otherwise, select No.
Frequency of Certain Words, by Section
By what percent has the price of an overcoat been reduced?
(1) The original price was $380.
(2) The original price was $50 more than the reduced price.
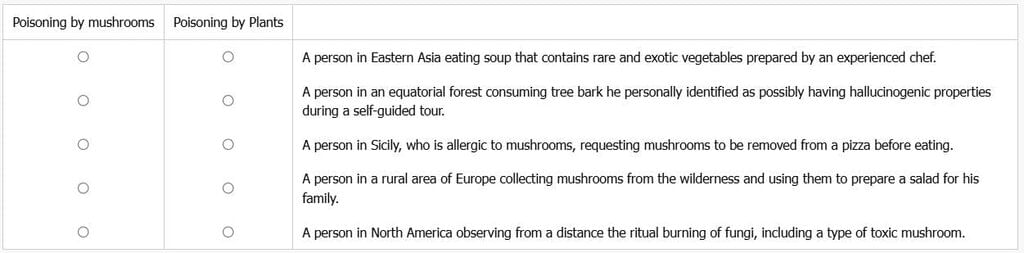
Poisoning from ingesting poisonous plants or mushrooms is a common issue, with particular significance in certain regions. For instance, tropical areas often serve as hotspots due to the prevalence of native poisonous plant species, sometimes used intentionally. In temperate regions, such as Europe and parts of North America, mushroom poisoning frequently results from accidental misidentification during foraging or wild cultivation. Certain types of plant or mushroom poisoning have relatively high fatality rates, particularly in cases of delayed treatment. However, these fatality rates vary by region; in some Western countries, the fatality rate for mushroom poisoning is relatively low.
Based on this information, select for Poisoning by mushrooms the statement that describes the situation in which an individual is most at risk of poisoning by mushrooms, and select for Poisoning by plants the statement that describes the situation in which an individual is most at risk of poisoning by plants. Make only two selections, one for each column.
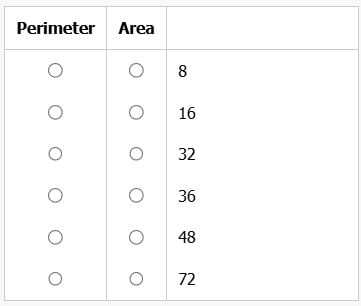
A rectangle has a Length : Width ratio of 3 : 1. From the table below, select a combination of Perimeter and Area that satisfies such a relationship.
For each statement, select the option from the drop-down menu that completes the statement as accurately as possible according to the information provided.
1. There are approximately ______ as many people age 100 or older in Asia and Europe combined than in South America.
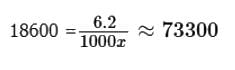
2. If there are 18,600 people aged 100 or older living in South America, then there are approximately _____ people aged 100 or older living in North America.
|
18 docs|33 tests
|
Important Questions for Data Insights - 4
Data Insights - 4 MCQs with Answers
Online Tests for Data Insights - 4 GMAT Mock Test Series 2025
|
© EduRev
|
Education Revolution
|


|


