GMAT Exam  >  GMAT Tests  >  GMAT Mock Test Series 2025  >  Test: Data Insights - 6 - GMAT MCQ

Test: Data Insights - 6 - GMAT MCQ


Test Description

20 Questions MCQ Test GMAT Mock Test Series 2025 - Test: Data Insights - 6

Test: Data Insights - 6 for GMAT 2025 is part of GMAT Mock Test Series 2025 preparation. The Test: Data Insights - 6 questions and answers have been prepared according to the GMAT exam syllabus.The Test: Data Insights - 6 MCQs are made for GMAT 2025 Exam. Find important definitions, questions, notes, meanings, examples, exercises, MCQs and online tests for Test: Data Insights - 6 below.
Solutions of Test: Data Insights - 6 questions in English are available as part of our GMAT Mock Test Series 2025 for GMAT & Test: Data Insights - 6 solutions in Hindi for GMAT Mock Test Series 2025 course. Download more important topics, notes, lectures and mock test series for GMAT Exam by signing up for free. Attempt Test: Data Insights - 6 | 20 questions in 45 minutes | Mock test for GMAT preparation | Free important questions MCQ to study GMAT Mock Test Series 2025 for GMAT Exam | Download free PDF with solutions
Test: Data Insights - 6 - Question 1

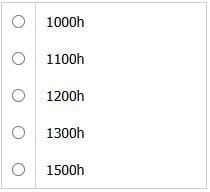
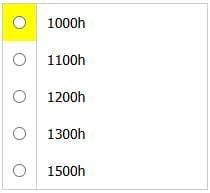
The maximum percentage increase in the price of a share on Day 2 compared to Day 1, at exactly the same time on both days, was at:

Detailed Solution for Test: Data Insights - 6 - Question 1

We have to look at the increase on Day 2 when compared to same time on day 1. So, at 0900h on day2 over 0900h on day 1.
Scan the graph for the maximum gap between two lines where yellow line is the lower line.
Two such points are at 1000h and 1500h. But we are looking at maximum % increase, so look which point has lower value on day 1 as that will be the reference point on which increase is made.
increase of 50 on 10 would give higher % than increase of 50 on 20. Hence, 1000h is the answer.

Test: Data Insights - 6 - Question 2

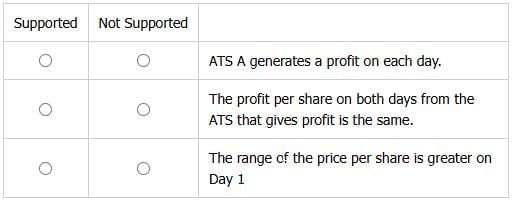
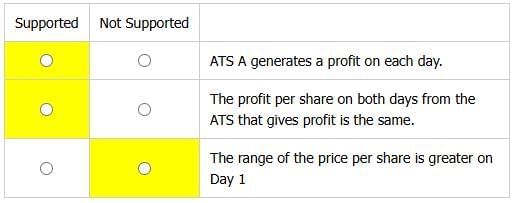
For each of the following statements, Choose'Supported' if the statement is true according to the information provided. Otherwise, choose 'Not Supported'

Detailed Solution for Test: Data Insights - 6 - Question 2

(a) The ATS A gives a profit on each day.
The ATS A buys shares at 0900h and sells half of it at 1200h and 1500h, so they are sold at an average of the prices at these two times.
Day 1: Buy - 120; sell - (120+140)/2 or 130...Hence profit of $10 per share
Day 2: Buy - 130; sell - (120+160)/2 or 140...Hence profit of $10 per share
Supported

(b) The profit per share on both the days by either of the ATS giving profit is the same.
ATS A gives profit on each day and is equal to $10 on each day. Hence, supported.

(c) The range of the price per share is more on Day 1.
The lower point of each line is at 110 but the higher point on Day 2 id 10 more than tha on day 1. Hence, the range will be higher on Day 2.
Not supported

Test: Data Insights - 6 - Question 3

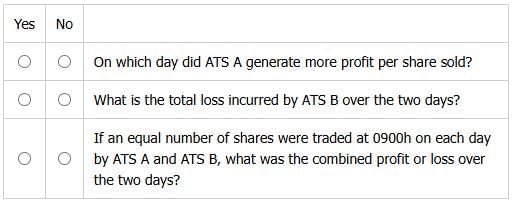
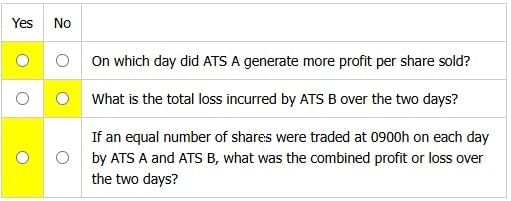
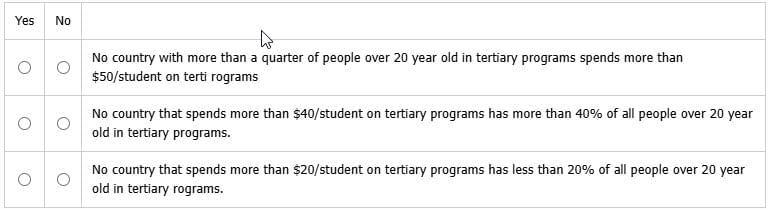
For each of the following statements, select 'Yes' if the question can be answered based on the information in the passage. Otherwise, select 'No'

Detailed Solution for Test: Data Insights - 6 - Question 3

(a) On which day did ATS A give more profit for each share sold?
ATS A gave the same profit of $10 per share. So, YES

(b) What is the total loss incurred by ATS B over the two days?
We do not know the exact number of shares purchased by the ATSs, so NO.

(c) If there were equal shares traded at 0900h on each day by ATS A and ATS B, what was the combined profit/loss over two days.
The activity done by A and B is opposite of each other at exactly the same time and for same amount, so the overall profit will be Zero...YES­

Test: Data Insights - 6 - Question 4

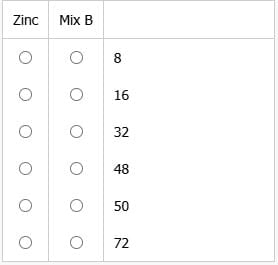
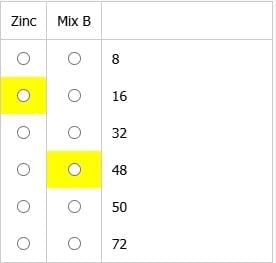
Brass is an alloy of copper and zinc whose proportions can vary to achieve different properties. Mix A, which weighs 50 kg, consists of 66% copper and 34% zinc in one such blend. This mix must be adjusted to increase its hardness by adding the maximum possible amount of zinc while ensuring that the zinc content does not exceed the weight of the copper in the new mix. Another blend, Mix B, contains 40% copper and 60% zinc and can be combined with Mix A to achieve the desired proportion.

Choose the weight of pure zinc in kg that would be added by combining Mix A with either zinc alone or with Mix B to meet the above requirement.

Detailed Solution for Test: Data Insights - 6 - Question 4

1. We are asked to find the maximum weight of zinc that was added (without breaking the requirement) after doing a method - either adding only zinc or adding Mix B.

2. It is known that amount of copper in Mix A is 66% of 50kg or 33kg and the amount of zinc in Mix A is 50-33 = 17kg. Our requirement states that the total amount of copper is greater than or equal to the total amount of zinc.

3. Let’s consider both methods:

  • Method 1: Pure Zinc. Since no copper is added, the amount of copper will be 33 kg. Let the amount of pure zinc added be Z. Then the total amount of zinc (the maximum that there can be) will be equal to 17+Z = 33 -> Z = 16 kg. So, our answer will be 16.
  • Method 2: Mix B. Mix B contains 40% copper and 60% zinc. To balance the mix, if B kg of Mix B is added, then 0.6B will be added to the existing 17 kg of zinc. Then the total amount of zinc (the maximum that there can be) will be equal to 17 + 0.6B = 33+0.4B -> 0.2B = 16 -> B = 80. This means that the amount of zinc added 0.6B = 0.6*80 = 48. So, our answer will be 48.
Test: Data Insights - 6 - Question 5

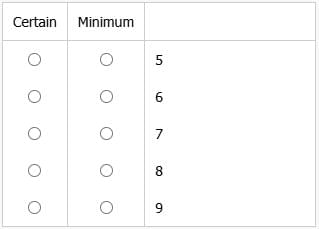
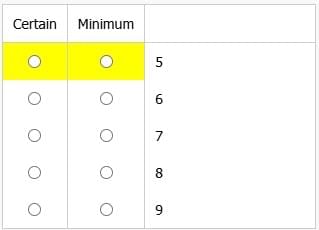
A bag contains 20 fruits of three types: apples, bananas, and oranges. Each type appears in a different quantity. The probability of picking any type of fruit is greater than 1/5 but less than 1/2

Choose for Certain a number that must represent the count of one type of fruit in the bag, and choose for Minimum a number that represents the smallest possible count of a type of fruit. 

Detailed Solution for Test: Data Insights - 6 - Question 5

Since the probability of picking any type of fruit is greater than 1/5 but less than 1/2,  the count of each type must be more than 4 and less than 10. This means each type has a count of 5, 6, 7, 8, or 9.
If the highest count is 9, the next highest can only be 6 (any other value would leave less than 5 for the third type), making the third count 5.
If the highest count is 8, the next highest can only be 7, making the third count 5.
The highest count cannot be 7 or less because, in that case, the total cannot reach 20 (e.g., 7 + 6 + 5 = 18).
Hence, the only possible distributions of fruits are (9, 6, 5) or (8, 7, 5).
Thus, a number that must represent the count of one type of fruit in the bag is 5, and the smallest possible count of a type of fruit is also 5.

Test: Data Insights - 6 - Question 6

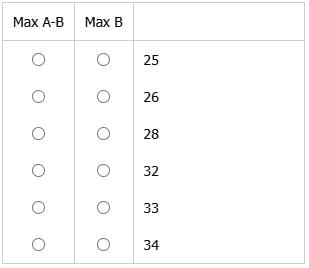
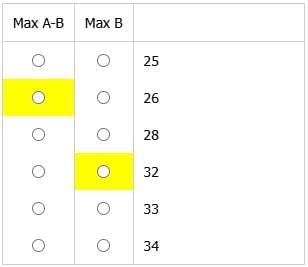
The class teacher divided 100 pencils amongst five students, A, B, C, D and E. The number of pencils received by A is equal to the sum of the pencils received by the three students, C, D and E. It is also known a ≥ b ≥ c ≥ d ≥ e,  where a, b, c, d and e are pencils received by A, B, C, D and E respectively.
On the basis of the information provided, Choose for Max A-B, the maximum difference between the number of the pencils received by A and  the number of the pencils received by B, and choose for Max B the largest number of the pencils that B could have got. 

Detailed Solution for Test: Data Insights - 6 - Question 6

We know a = c + d + e, and a + b + c + d + e = 100 or a + b + a = 100, that is 2a + b=100

Max A-B: We are looking into the difference of the two largest numbers, that is a - b. To make it the largest, we have to make a the largest possible and b the smallest possible.
The smallest value of b will be when it is equal to c, and c is also least possible.
Now, c + d + e = a
For c to be least, let it be equal to d and e, so c + c + c = a or c = a/3.
Therefore, a + b + (c + d + e) = 100 or a + c + (a) = 100 ............. 2a + a/3 
= 100...........7a = 300........a  = 42.89
As a is an integer, the maximum value of a is 42.
Value of b = 42+b+42 = 100.......b=16
Max A-B = 42-16 = 26
Max B: We know 2a + b = 100, so to get maximum value of b, we have to minimize a. 
Let b be equal to a, then 3a = 100 and a = 33.33
If a = 33, then b becomes 100 - 2 * 33 or 34, making b>a.
So a = 34, and b = 100 - 2 * 34 or 32.

Test: Data Insights - 6 - Question 7

A basket contains apples and oranges only. If 2 fruits are randomly selected from the basket one after another without replacement, what is the probability that at least one of them is an apple? 

(1) The number of oranges in the basket is twice the number of apples.
(2) If 2 fruits are randomly selected from the basket one after another with replacement, the probability that at least one of them is an apple is 5/9.

Detailed Solution for Test: Data Insights - 6 - Question 7

(1) The number of oranges in the basket is twice the number of apples.
This implies O = 2A. Different numbers of oranges and apples will give different probabilities. For example, if there are 2 oranges and 1 apple, then the probability of selecting at least one apple would be P(at least one apple) = 1 - P(no apples) = 1 - (2/3 * 1/2) = 2/3. However, if there are 4 oranges and 2 apples, then the probability of selecting at least one apple would be P(at least one apple) = 1 - P(no apples) = 1 - (4/6 * 3/5) = 3/5.
(2) If 2 fruits are randomly selected from the basket one after another with replacement, the probability that at least one of them is an apple is 5/9.
This implies 1 - O/(O + A) * O/(O + A) = 5/9:
(O/(O + A))2 = 4/9
O/(O + A) = 2/3
3O = 2O + 2A
O = 2A.
As discussed above, such a ratio is not sufficient to get a unique answer. Not sufficient.
(1) + (2) Both statements give the same exact information: O = 2A. Thus, combining them does not add anything new. Not sufficient.

Correct Answer: E.

Test: Data Insights - 6 - Question 8

What is the length of Train A if it crosses Bridge X in 30 seconds from the moment it enters the bridge to the moment its final carriage exits the bridge?
(1) Train B, which is 200 meters long, traveling at a constant speed of 20 meters per second, crosses Bridge X in 40 seconds.
(2) The end of Train A, which is traveling at a constant speed, passes a pole in 10 seconds from the moment the train meets the pole.

Detailed Solution for Test: Data Insights - 6 - Question 8

A: Length of train A
X: Length of bridge X
SA: speed of train A

A + X = 30 * SA
⇒ We need to know X and SA 

­Statement (1):
Train B's length (200 meters) and speed (20 meters/second).
Train B crosses the bridge in 40 seconds (total distance = speed x time).
This tells us the total distance Train B needs to cover, which includes its own length (200 meters) and the length of Bridge X (X).
We can set up an equation: 200 + X = 20 * 40 (meters).
⇒ X = 600 
But we do not know about SA
⇒ Insufficient

Statement (2):
We know the time it takes for the end of Train A to pass a pole (10 seconds).
This tells us the speed of Train A (length of train passing the pole / time) if we knew the length of the train A, which is what we need to find

⇒ This statement gives no useful info
⇒ Insufficient

Combining Statements (1) and (2):
Even with both statements, we still lack crucial information.
Statement (1) provides X.
Statement (2) gives no useful info.

⇒ Insufficient
Therefore, BOTH statements TOGETHER are not sufficient to find the length of Train A.
So the answer is: Statements (1) and (2) TOGETHER are not sufficient.

Test: Data Insights - 6 - Question 9

Marco is making z pizzas and will distribute x slices of pepperoni to the pizzas so that every pizza has the same number of slices of pepperoni. If the number of slices of pepperoni is more than three times the number of pizzas but less than eight times the number of pizzas, and Marco will make at least four pizzas, what is the number of slices of pepperoni Marco uses?

(1) If Marco makes 2 fewer pizzas than he does, he would be able to distribute the x pepperoni slices evenly among them.
(2) If Marco makes 5 more pizzas than he does, he would be able to distribute the x pepperoni slices evenly among them.

Detailed Solution for Test: Data Insights - 6 - Question 9

No. of pepperoni slices for each pizza = x / z (x must be divisible by z)
We know: 3z < x < 8z
z > or = 4
We need to find x

S1: x is divisible by (z - 2) - clearly not enough information to determine x or z
S2: x is divisible by (z + 5) - clearly not enough information to determine x or z

Combining: x is divisible by (z - 2), z and (z + 5)
case 1: z = 4: x is divisible by 2, 4 and 9 i.e. 36 - but 36 does not lie between 3z and 8z - not possible
case 2: z = 5: x is divisible by 3, 5 and 10 i.e. 30, which lies between 3z = 15 and 8z = 40
case 3: z = 6: x is divisible by 4, 6 and 11 i.e. 132 - but 132 does not lie between 3z and 8z - not possible
case 4: z = 7: x is divisible by 5, 7 and 12 i.e. 420 - but 420 does not lie between 3z and 8z - not possible

With higher values of z, the value of x will not lie between 3z and 8z
Thus, only z = 5 is possible - Sufficient
Correct Answer: C

Test: Data Insights - 6 - Question 10

­A hotel has 80 rooms and charges the same amount per night for each occupied room. This is the hotel's only source of revenue. In September, the average (arithmetic mean) number of rooms occupied per night was 60. How many nights in September were all the rooms in the hotel occupied?
(1) On the nights when not all the rooms of the hotel were occupied, the average number of rooms occupied was 40.
(2) In September, the total revenue for the nights when all the rooms of the hotel were occupied was twice the revenue for the nights when not all the rooms were occupied.­

Detailed Solution for Test: Data Insights - 6 - Question 10

Let the amount per night be x, so total revenue is 60 * 30 * x (average * number of days in September * charge per night)

1. On the nights when not all the rooms of the hotel were occupied, the average number of rooms occupied was 40.
That is on night when full booked, 80 rooms are occupied and when not fully booked, average of rooms is 40.
Hence, the overall average 60, right in Center of the two constituent averages 40 and 80, tells us that the number of days of these averages is same. So 15 days for fully occupied and remaining 15 for certain rooms empty.
Sufficient

2. In September, the total revenue for the nights when all the rooms of the hotel were occupied was twice the revenue for the nights when not all the rooms were occupied.­­­­
Revenue when fully booked = 80x per day.
If z days were fully occupied, revenue = 80xz
The remaining days it is half of this, so 40xz.
Total revenue = 80xz + 40xz = 120xz = 1800x
120z = 1800…..z = 15
Sufficient again

Correct Answer: D

Test: Data Insights - 6 - Question 11

A group of people is seated at a table at which a toast is made. Following the toast, each person must clink glasses exactly once with each of the other people at the table. If each clink is produced by the glasses of only two people, how many people are seated at the table?

(1) If two fewer people were seated at the table, there would be at least 17 but no more than 19 fewer clinks.
(2) If two more people were seated at the table, there would be at least 18 but no more than 21 fewer clinks.

Detailed Solution for Test: Data Insights - 6 - Question 11

2 people = 1 clinks
3 people = 3 clinks
4 people = 6 clinks
5 people = 10 clinks
6 people = 15 clinks
7 people = 21 clinks
8 people = 28 clinks
9 people = 36 clinks
10 people = 45 clinks
11 people = 55 clinks
12 people = 66 clinks.

(1) If two fewer people were seated at the table, there would be at least 17 but no more than 19 fewer clinks.
If current # of people is 10, then 2 fewer would be 8. Corresponding # of clinks is 45 and 28.
45 - 28 = 17 (O)
If current # of people is 11, then 2 fewer would be 9. Corresponding # of clinks is 55 and 36.
55 - 36 = 19 (O)
There could be 10 or 11 people.

(2) If two more people were seated at the table, there would be at least 18 but no more than 21 fewer clinks.
If current # of people is 9 then 2 more would be 11. Corresponding # of clinks is 36 and 55.
55 - 36 = 19 (O)
If current # of people is 10, then 2 more would be 12. Corresponding # of clinks is 45 and 66.
66 - 45 = 21 (O)
There could be 9 or 10 people.
Together, we know 10 people is the answer.

Test: Data Insights - 6 - Question 12

­Each correctional facility in a certain state has the same number of interns, and each facility has interns of each sex. If Lockwood Correctional Facility has 22% of the female interns in the state, does it have less than 20% of the male interns?

(1) Lockwood has between 18% and 22% of the state's male interns.
(2) Lockwood has more female interns than does any other facility in the state.­

Test: Data Insights - 6 - Question 13

Revenue Share of Most Popular Pizzas

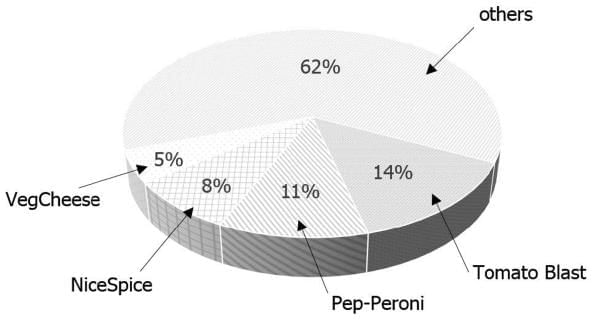
­A certain pizzeria has more than fifty types of pizzas on its menu. The chart shows the revenue share, in the pizzeria’s total revenue in the last month, of its four most popular pizza types. Each pizza type has only a single size and a single price.

Which was their best-selling pizza last month in terms of number of pizzas sold?
(1) The number of customers who ordered at least one Pep-Peroni pizza last month was greater than the number of customers who ordered at least one of any other pizza type last month.
(2) The lowest-priced pizza type on the pizzeria’s menu is Tomato Blast, followed by VegCheese.­­­

Detailed Solution for Test: Data Insights - 6 - Question 13

"Most Popular pizzas" implies the ones sold the most in number. So we know that Tomato, Pep, Nice and Veg are the ones sold most in number. Their revenues are given with the highest revenue belonging to tomato which is 14%. This does not imply that Tomato is the one most sold number-wise because if it is more expensive than Pep, say, then more of Pep could have been sold but revenue could be higher of Tomato. So we need some data to say which one was sold in most quantity.
(1) The number of customers who ordered at least one Pep-Peroni pizza last month was greater than the number of customers who ordered at least one of any other pizza type last month.
Number of customers is irrelevant. If fewer customers bought 100 pizzas of variety 1 and many more customers bought only 1 pizza of variety 2, more number of pizzas of variety1 could have easily been sold.
- Not sufficient.

(2) The lowest-priced pizza type on the pizzeria’s menu is Tomato Blast, followed by VegCheese.­
Tomato is the cheapest pizza still it got the max revenue. This means Tomato must have been sold in maximum quantity.
- Sufficient alone.

Correct Answer: B

Test: Data Insights - 6 - Question 14

A school district surveyed 100 parents to gather their opinions on the district's budgetary priorities. The table shows the percentages of all survey respondents who indicated that they strongly agreed, somewhat agreed, somewhat disagreed, or strongly disagreed that each of the four actions should occur. No other response options were available. No respondent could choose more than one response option for each action. Not every respondent gave an opinion for every activity.

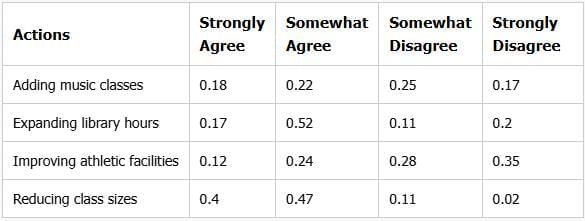
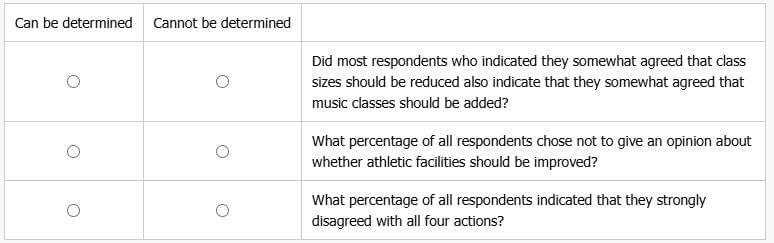
For each of the following questions, choose if the answer to that question can be determined from the information given. Otherwise, choose Cannot be determined.­

Detailed Solution for Test: Data Insights - 6 - Question 14

Option 1: 
47% of the respondents somewhat agreed that class sizes should be reduced.
22% of the respondents somewhat agreed that music classes should be added.
Since 22% is less than half of 47%, we know for sure that it is NOT the case that most respondents who indicated they somewhat agreed that class sizes should be reduced also indicate that they somewhat agreed that music classes should be added. After all, "most" of 47% is more than half of 47% or at least 24% of the respondents., which is greater than 22%.
So, even without knowing how individual respondents responded, we can answer this question.
Mark "Can be determined."

Option 2:
Since the text information says, "No respondent could choose more than one response option for each action," we know that the percentages in the four columns for "Improving athletic facilities" add up to the total percentage of respondents who chose to give an opinion about whether athletic facilities should be improved."
So, we can calculate the percentage who chose not to give an opinion about whether athletic facilities should be improved by totaling the four percentages in the four columns and subtracting from 100.
Knowing that we can calculate the percentage this question asks about, we can answer this question, "Can be determined," without doing the math.
If you want to see how the math works, it's 1.00 - (0.12 + 0.24 + 0.28 + 0.35) = 1.0 - 0.99 = 0.01 or 1%.
Mark "Can be determined."

Option 3: 
we can simply take the smallest of the four percentages in the Strongly Disagree column, 0.02, as the percentage of all respondents who indicated that they strongly disagreed with all four actions.
However, we have to keep in mind that respondents who strongly disagreed with one action may not have strongly disagreed with another. So, the respondents who strongly disagreed with one action may or may not be the same as those who strongly disagreed with one or more of the other actions.
Thus, it could be that 2% of the respondents strongly disagreed with all four actions, 0% of the respondents strongly disagreed with all four actions, or a percentage between 2% and 0% strongly disagreed with all four actions.
So, the information provided does not allow us to answer this question.
Mark "Cannot be determined."

Test: Data Insights - 6 - Question 15

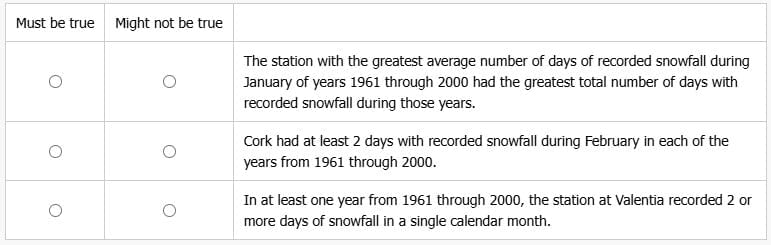
The table shows, for each of 10 Irish weather stations and each of 8 calendar months, the average (arithmetic mean) number of days per month that the station recorded snowfall during the years 1961–2000. For example, during this time period, the station at Birr recorded snowfall on an average of 4.5 days in January.

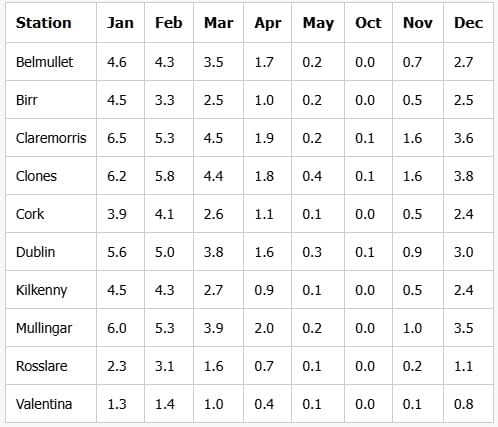
For each of the following statements about the weather stations listed in the table, chooset Must be true if that statement must be true if the information provided is correct. Otherwise, choose Might not be true.

Detailed Solution for Test: Data Insights - 6 - Question 15

Option 1: 
The station with the greatest average number of days of recorded snowfall during January of years 1961 through 2000 had the greatest total number of days with recorded snowfall during those years.
Sort the table by Jan month. Claremorris has the greatest average number of days, which is 6.5
However, when you compare the averages every month of Claremorris with Clones, you can easily make it the averages are more for clones. We do not require to multiply number of days with the averages to get to the answer. The gap in the avergaes between the two stations cannot be covered by minor variations in days in months of a year.
Hence, 'Might not be true' is the answer.

Option 2: 
Cork had at least 2 days with recorded snowfall during February in each of the years from 1961 through 2000.
The average over a month cannot tell us about the rains on the individual days.
Clearly, need not be true.

Option 3: 
In at least one year from 1961 through 2000, the station at Valentia recorded 2 or more days of snowfall in a single calendar month.
Valentia had average rainfall of 1.3 and 1.4 in Jan and Feb. If rainfall was recorded on only one day each Feb every year, then the average would be 1 or less.
But 1.3 means, there were some years when the rains were there on at least 2 days.
Must be true

Test: Data Insights - 6 - Question 16

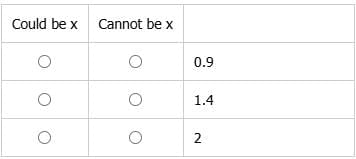
For each of the following values, Choose Could be x if that exact value for x is consistent with the information provided. Otherwise, choose Cannot be x.or each of three years and five survey prompts, the table shows the percentage of respondents to a job-satisfaction survey who agreed with the prompt. For columns showing pairs of years in the top row, a minus sign (–) or plus sign (+) for a prompt indicates that the change in the percentage of respondents from the first year to the second represents a significant decrease or significant increase, respectively. For the difference in the number of percentage points to be considered significant, its absolute value must be greater than a certain number, x. Although the percentages in the table are rounded to the nearest percentage point, whether a change is significant is determined using the raw percentages prior to rounding.


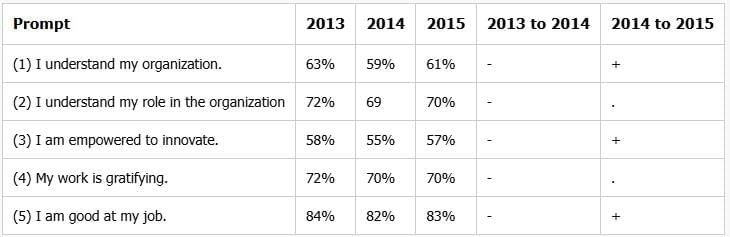
For each of the following values, choose Could be x if that exact value for x is consistent with the information provided. Otherwise, choose Cannot be x.

Detailed Solution for Test: Data Insights - 6 - Question 16

Difference in percentage points from one year to another was calculated. If it was more than x, a +/- was put. If it was less than x, it was left blank. 
Then the given values in the table were rounded. So each given value, say 63% could actually be anything from 62.5% (including) to 63.5%(excluding).
Focus on the values where the difference is smallest possible but 'significant'.
In 14-15, 82% - 83% is significant. Here the actual difference could be 81.5% to a little less than 83.5%. So the maximum actual difference could be slightly less than 2. So x can be slightly less than 2 but it cannot be 2. If x were 2, then this would have been 'not significant.'
Focus on the values where the difference is largest possible but 'not significant'.
In 14-15, 69% - 70% is not significant­
These could be a little less than 69.5% and 69.5% so the minimum value of x could be very little (slightly more than 0).
Say actual values here could be 69.4% - 69.5%. Then if x = 0.1, even then these would be 'not significant'.
Hence x can easily take very small values so 0.9 and 1.4 are both acceptable. 

Test: Data Insights - 6 - Question 17

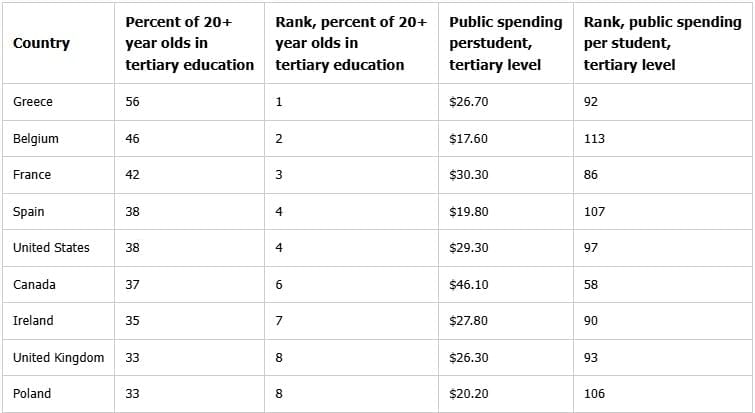
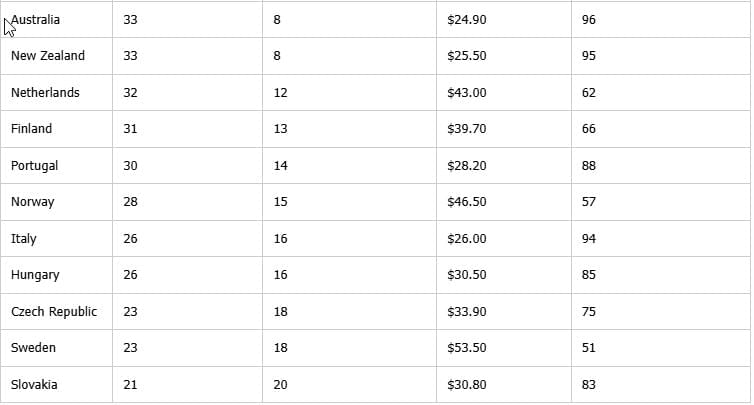
The following tables show the data on “tertiary education”

Note that “tertiary education” means all education following high school level: undergraduate as well as graduate studies. Here, “in tertiary education” includes those now enrolled in those programs, as well as all who have completed degrees. Note, also, many of the countries in the table have a high percent of total students in the table, and therefore rank considerably lower in public spending per tertiary student: countries with comparatively few students at the tertiary level rank much higher than the countries listed in the table.

Test: Data Insights - 6 - Question 18

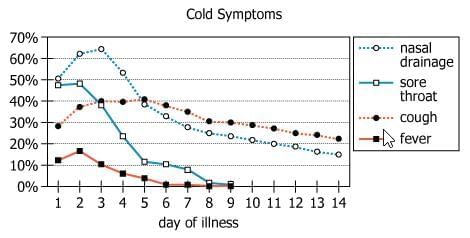
For each of four symptoms, the graph shows the percentage chances that someone will have that symptom on each day of the 2 weeks after first developing a cold. The lines for certain symptoms do not continue past a certain day because the chance that someone will have those symptoms beyond that day is less than 1%.
Choose the options (A) and (B) that create the statement that is most strongly supported by the information provided.
It can be determined from the graph that the probability is greater than 0.98 that someone with a cold will have  ___(A)____ of the four symptoms on day ___(B)____

Detailed Solution for Test: Data Insights - 6 - Question 18

Total probability = P(no symp) + P (exactly 1) + P (exactly 2) + P(exactly 3) + P (exactly 4) 
We need to find probability that is greater than 0.98 , meaning almost 1. This implies that almost covers all the cases. 
Acc. to options, we have Day 2 , Day 6 , Day 10 
For Day 2 and Day 6, 
Total probability = P(no symp) + P (exactly 1) + P (exactly 2) + P(exactly 3) + P (exactly 4) 
Options given: one or fewer, one or more, two or fewer, exactly two
None of the options cover all the cases. 
For Day 10,
Total probability = P(no symp) + P (exactly 1) + P (exactly 2)
In this case, two or fewer cover all the cases. 
answer: two or fewer, Day 10

Test: Data Insights - 6 - Question 19

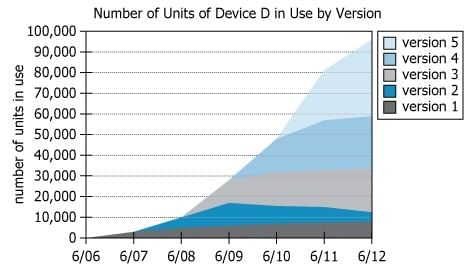
As of the beginning of June 2012 (6/12), Device D (an Internet-connected device) was available in exactly 5 versions. Version 1 became available at the beginning of June 2006 (6/06), and a new version became available at the beginning of each subsequent June, with Version 5 becoming available at the beginning of June 2010 (6/10). The graph shows the number of units of Device D in use, by version, at the beginning of each June from 2006 through 2012. For example, at the beginning of June 2008 (6/08), there were approximately 10,000 units of Device D in use, approximately 5,000 of which were Version 1 and approximately 5,000 of which were Version 2.
Based on the information above, choose the option (A) and (B) that completes the statement most accurately.
During the first calendar year throughout which the graph suggests a decrease over time in the number of devices in use of Version   _____(A)____, Version _____(B)____  became available.­

Detailed Solution for Test: Data Insights - 6 - Question 19

The catch word is calendar.

So, we look at first calendar year, for which we have to look from 01/07 to 01/08 and then from 01/08 to 01/09.
Where do these 01/08 or 01/09 etc lie?
They are in middle of every two tick, that is middle of 06/07 and 06/08 will give 01/08.
Now, when you know what you have to look at, look for a period HALF way between two ticks to next HALF way between adjoining ticks that gives a decrease in any version.
THe decrease is only in version 2, and the entire calendar year is given by point from 01/10 to 01/11. During this period, version 5 starts.
If you are looking from 06/09 to 06/10, you will surely mark 4 as answer, an answer that would be wrong.
Answer: Version 2 and Version 5.

Test: Data Insights - 6 - Question 20

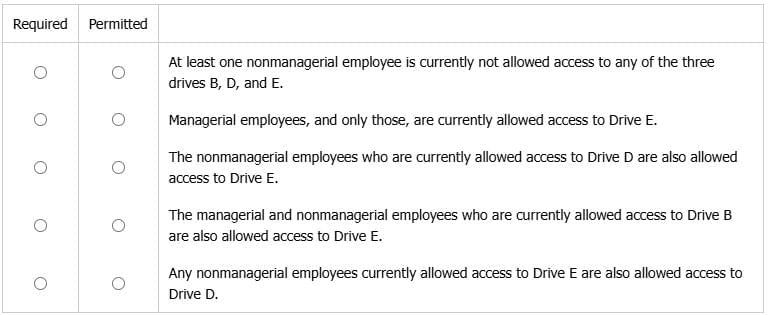
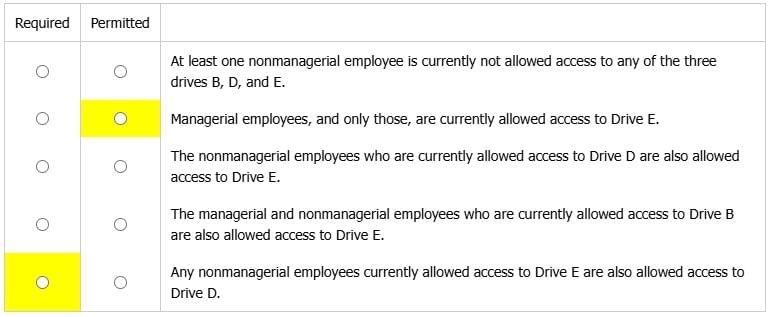
To ensure computer security, a firm has rules about access of managerial and nonmanagerial employees to various networked computer drives. In accordance with the rules, some but not all nonmanagerial employees are allowed access to both Drive B and Drive D. Some are required to have such access. Every nonmanagerial employee must have access to at least one of Drive B and Drive D. No nonmanagerial employee is allowed to have access to both Drive B and Drive E. The rules do not restrict the access of managerial employees to any of the drives mentioned.

From the following statements about computer security practices in relation to the firm's employees, select for Required the statement that, based on the information provided, describes a practice that is required by the rules, and select for Permitted the statement that describes a practice that is permitted, but NOT required, by the rules. Choose only two selections, one in each column.­

Detailed Solution for Test: Data Insights - 6 - Question 20

Required Conditions (Necessary):
Some NM are required to have access to both B and D (but all should not have)
Every nonmanagerial employee must have access to at least one of Drive B and Drive D.
No nonmanagerial employee is allowed to have access to both Drive B and Drive E.

Permitted Conditions (Allowed but not necessary):
M are permitted any ­access.
NMs can have access to drive E (but then they should not have access to B)

- At least one nonmanagerial employee is currently not allowed access to any of the three drives B, D, and E.
Not possible.
Every nonmanagerial employee must have access to at least one of Drive B and Drive D.

- Managerial employees, and only those, are currently allowed access to Drive E.
Possible but not necessary. NMs can also get access to drive E but it is not necessary that at least one of them should have this access. Hence it is possible, but not necessary that only Ms have access to drive E currently. 
(PERMITTED)

- The nonmanagerial employees who are currently allowed access to Drive D are also allowed access to Drive E.
Not possible.
Some NM have access to both B and D. They cannot have access to E though they have access to D.

- The managerial and nonmanagerial employees who are currently allowed access to Drive B are also allowed access to Drive E.
Not possible. Those NM with access to B cannot have access to E.

- Any nonmanagerial employees currently allowed access to Drive E are also allowed access to Drive D.
All NMs must have access to B or to D. This is necessary. Any NM with access to E cannot have access to B. So this NM must have access to D. It is is necessary. 
(REQUIRED)­

18 docs|33 tests
Information about Test: Data Insights - 6 Page
In this test you can find the Exam questions for Test: Data Insights - 6 solved & explained in the simplest way possible. Besides giving Questions and answers for Test: Data Insights - 6, EduRev gives you an ample number of Online tests for practice
Download as PDF