GMAT Exam  >  GMAT Tests  >  GMAT Mock Test Series 2025  >  Test: Data Insights - 8 - GMAT MCQ

Test: Data Insights - 8 - GMAT MCQ


Test Description

20 Questions MCQ Test GMAT Mock Test Series 2025 - Test: Data Insights - 8

Test: Data Insights - 8 for GMAT 2025 is part of GMAT Mock Test Series 2025 preparation. The Test: Data Insights - 8 questions and answers have been prepared according to the GMAT exam syllabus.The Test: Data Insights - 8 MCQs are made for GMAT 2025 Exam. Find important definitions, questions, notes, meanings, examples, exercises, MCQs and online tests for Test: Data Insights - 8 below.
Solutions of Test: Data Insights - 8 questions in English are available as part of our GMAT Mock Test Series 2025 for GMAT & Test: Data Insights - 8 solutions in Hindi for GMAT Mock Test Series 2025 course. Download more important topics, notes, lectures and mock test series for GMAT Exam by signing up for free. Attempt Test: Data Insights - 8 | 20 questions in 45 minutes | Mock test for GMAT preparation | Free important questions MCQ to study GMAT Mock Test Series 2025 for GMAT Exam | Download free PDF with solutions
Test: Data Insights - 8 - Question 1

Which one of the following statements most accurately describes a relationship between the table and the introduction?

Test: Data Insights - 8 - Question 2

For each of the following statements about Nation X, choose Yes if it describes a situation that the given information suggests may have resulted from the experimental incentive scheme. Otherwise, choose No.

Test: Data Insights - 8 - Question 3

For each of the following statements about Nation X, select Consistent if the statement is consistent with the information provided. Otherwise, select Inconsistent.

Test: Data Insights - 8 - Question 4

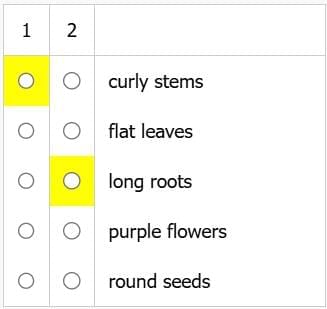
Each of three botanists made a hypothesis regarding specimens of a particular plant species:

  • Botanist 1: Any individual specimen possessing the gene for curly stems has either the gene for long roots or the gene for purple flowers, or both.
  • Botanist 2: Any individual specimen possessing the gene for long roots has either the gene for flat leaves or the gene for round seeds, or both.
  • Botanist 3: No individual specimen that possesses either the gene for curly stems or the gene for flat leaves or both has the gene for purple flowers.

The discovery of an individual specimen of the plant species in question having the gene for __1__ but NOT the gene for __2__ would show that at least one of the three hypotheses described is incorrect.
Choose for 1 and for 2 the characteristics that would most accurately complete the statement, based on the information given. Make only two selections, one in each column.­

Detailed Solution for Test: Data Insights - 8 - Question 4


curly stems - flat leaves: not against the hypothesis, as curly stem could have round seed, and not necessarily flat leaves → eliminate
curly stems - long roots: correct, as we know curly stem can have either long root or purple flowers or both (according to Botanist 1), but according to Botanist 3, curly stem cannot have purple flower. That leaves us with the only choice: curly stem must have long root. And now, if the curly stems don't even have the long root, then that's a big paradox.
curly stems - purple flowers: not against the hypo - it's actually the idea of Botanist 3. → eliminate
curly stems - round seeds: not against the hypothesis, as curly stem could have flat leaves, and not necessarily round seeds → eliminate
and so on...

Test: Data Insights - 8 - Question 5

­An inventory of a neighborhood's trees found that 32 percent were conifers and most of the rest were deciduous. Among the conifers were 258 spruces and 112 pines, along with some cedars and other species. Most of the deciduous trees were oaks, but one in eight was a maple. Of the oaks, 65 percent were red oaks and 25 percent were white oaks. Of the maples, 20 percent were Japanese maples.
Choose for A and for B two types of trees such that the ratio of the number of trees of the type choose for A to the number of trees of the type choose for B can be determined and is less than 1. Make only two selections, one in each column.­

Detailed Solution for Test: Data Insights - 8 - Question 5


Conifers = 32% of ALL TREES = 258 spruce + 112 pines + some cedars & others
Deciduous = 68% of ALL TREES
Oaks > 50% of Deciduous (i.e. 50% of 68% of ALL TREES)
Maple = 1/8 of Deciduous = 12.5% of Deciduous = 12.5% of 68% of ALL TREES
Red Oaks = 65% of oaks
White Oaks = 25% of oaks
Japanese Maples = 20% of Maples = 20% of 12.5% of 68% of ALL TREES

From the above data if we take some numerical figure for ALL TREES we can say confidently that we can determine A & B and A < B only for Deciduous trees and Japanese Maple, because all the others are unknown quantity and cannot be determined.

A = Japanese Maple
B = Deciduous trees

Test: Data Insights - 8 - Question 6

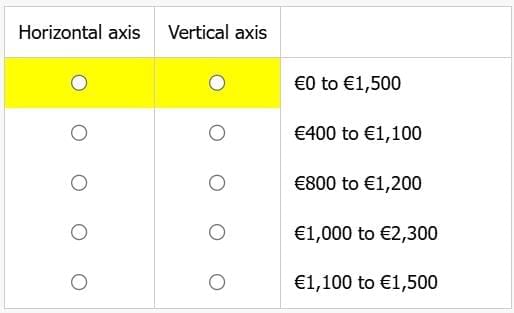
Throughout a certain decade in a European city, the mean monthly rents for studio apartments varied yearly, from a low of €804 to a high of €1,173. Those for one-bedroom apartments also varied yearly, from a low of €1,060 to a high of €1,497. But some individual studio apartments rented for as little as €420 in some years, and some one-bedroom apartments rented for up to €2,262. To visually assess how the ratio of mean monthly rents for studio apartments to those for one-bedroom apartments varied yearly over the decade, Maria requires a graph with the following characteristics. The graph will have two axes of equal length, with mean rents for one-bedroom apartments shown on the horizontal axis and mean rents for studio apartments shown on the vertical axis, and with the same scale on both axes. For each year, mean rents will be plotted as a point.
From the following options, choose for Horizontal axis a range for the points on the horizontal axis and choose for Vertical axis a range for the points on the vertical axis that together would satisfy Maria's requirements for the graph. Make only two choose, one in each column.

Detailed Solution for Test: Data Insights - 8 - Question 6

The graph must have the following characteristics:
- two axes of equal length
- mean rents for one-bedroom apartments shown on the horizontal axis
- mean rents for studio apartments shown on the vertical axis
- the same scale on both axes
- For each year, mean rents will be plotted as a point.
The passage provides several values. However, the graph will show only mean rents. So, the only values that matter are the following:
Studio apartments:
a low of €804 to a high of €1,173   
One-bedroom apartments:
a low of €1,060 to a high of €1,497

So, the axis for studio apartments must go at least from around 800 to around 1,200, and the axis for one-bedroom apartments must go at least from around 1,000 to around 1500.
€0 to €1,500
€400 to €1,100
€800 to €1,200
€1,000 to €2,300
€1,100 to €1,500

One of the characteristics of the graph is that it has two axes of equal length. Scanning the choices, we see that only two are of the same length: €800 to €1,200 and €1,100 to €1,500.
€800 to €1,200 would work for studio apartments since it allows for a low of €804 and a high of €1,173.
However, €1,100 to €1,500 does not work for one-bedroom apartments since it does not allow for the low of €1,060.
So, it must be the case that one of the choices works for both axes since only by using one choice for both can we get axes of equal length and include all the values.
(Also, by the way, if one choice works for both, that choice must be the correct answer since the question cannot be answerable in two ways.)
To have the points for all the values of mean rents, the axes must go at least from a low of around 800 to a high of around 1,500. The only choice that includes both of those values is €0 to €1,500.
So, the correct answer for both Horizontal axis and Vertical axis is €0 to €1,500.
Answer: €0 to €1,500, €0 to €1,500­­

Test: Data Insights - 8 - Question 7

­For every dollar of sales charged to a certain bank credit card, a department store must pay $0.003 to the bank that issued the credit card. What percentage of the department store's sales transactions last month were credit card transactions?
(1) The store made 2,000 sales last month.
(2) The store took in a total of $250,000 last month and paid $300 to the bank that issued the credit card.

Detailed Solution for Test: Data Insights - 8 - Question 7

We need Credit card transactions / total transactions:
(1) The store made 2,000 sales last month.
We do not know that total number of credit card transactions:
INSUFF.

(2) The store took in a total of $250,000 last month and paid $300 to the bank that issued the credit card.
Using this we can calculate the total number of credit card transactions.
However it is not possibe to get the overall total number of transactions:
INSUFF.
1+2
From 1 we know the total number of transactions
From 2 we know the total number dollars that we got using credit card. (300/.003)
However we still did not know the number of credit card transactions.
INSUFF.
Ans E

Test: Data Insights - 8 - Question 8

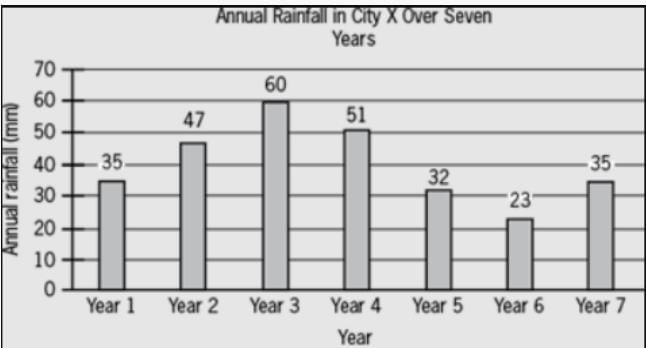
­The annual rainfall in a city over the past 50 years is its historical average rainfall (HAR). The graph above shows the annual rainfall in City X over a seven-year period. All figures are rounded to the nearest integer.

Is it true that the rounded HAR for City X is 47 mm or greater?
(1) In the seven-year period in City X, the annual rainfall was greater than the HAR in exactly two of the consecutive years.
(2) In the seven-year period in City X, the annual rainfall was less than the HAR in exactly four of the years.­

Detailed Solution for Test: Data Insights - 8 - Question 8

HAR is over 50 years, while what is given in the graph is rainfall over 7 consecutive years. Based on the graph, we are asked whether HAR is at least 47mm.
(1) In the seven-year period in City X, the annual rainfall was greater than the HAR in exactly two of the consecutive years.
So we look at the highest rainfall. The question becomes easy as the two highest rainfalls have been in two consecutive years, year 3 and year 4.
This further tells us that the rainfall in year 2, which would otherwise be part of the above mentioned two consecutive years, making two consecutive years as three consecutive years, was not more than the HAR.
Thus, rainfall of 47mm is not more than the HAR or, in other words, HAR is at least 47mm.
Sufficient

(2) In the seven-year period in City X, the annual rainfall was less than the HAR in exactly four of the years.­
The four least rainfall have been in year 1, 5, 6 and 7, so HAR is surely more than 35.
The trap comes now: the next higher rainfall shown is 47, and one could mark this too sufficient.
But HAR need not be one of the rainfalls mentioned on graph, so HAR could be anything greater than 35 but less than 47, inclusive.
Insufficient

Answer is (A)

Test: Data Insights - 8 - Question 9

On a farm with a total of 72 animals, some are goats, and the rest are cows. If there is at least one goat and at least one cow, what is the positive difference between the number of vaccinated goats and vaccinated cows?
(1) One-fourth of the goats and one-ninth of the cows are vaccinated.
(2) The ratio of vaccinated goats to vaccinated cows is 9 to 4.

Detailed Solution for Test: Data Insights - 8 - Question 9

(1) One-fourth of the goats and one-ninth of the cows are vaccinated.
Assuming there are g goats and 72 - g cows, the positive difference between the number of vaccinated goats and vaccinated cows would be |g/4 - (72 - g)/9| = |13g/36 - 8|. Since the difference must be an integer, 13g/36 must be an integer, meaning that g, the number of goats, must be a multiple of 36. Given that 0 < g < 72, the only possible value of g is 36, making the difference equal to |13g/36 - 8| = 5. Sufficient.
Alternatively, assuming the number of vaccinated goats is m and the number of vaccinated cows is n, we’d get 4m + 9n = 72. From this, we can deduce that m must be a multiple of 9 (for 4m + (a multiple of 9) to equal a multiple of 9). The only non-negative value of m that works is m = 9, giving n = 4, and the difference of m - n = 9 - 4 = 5. Sufficient.

(2) The ratio of vaccinated goats to vaccinated cows is 9 to 4.
If the number of vaccinated goats and cows are 9 and 4, respectively, the difference would be 5. However, if those numbers are 18 and 8, the difference would be 10. We already have two different answers; hence, this statement is not sufficient.
Answer: A

Test: Data Insights - 8 - Question 10

Rosalie tosses a coin a number of times and counts the total number of times the coin lands tail-side up. How many times does she toss the coin?
(1) The chance that the coin lands tail-side up exactly once is between 0.1 and 0.2.
(2) The chance that the coin lands head side up exactly once is the same as the chance that the coin lands tail-side up exactly once.

Detailed Solution for Test: Data Insights - 8 - Question 10

­(1) The chance that the coin lands tail-side up exactly once is between 0.1 and 0.2.
The chances of landing one tails and an infinite number of heads will be 
The 1/2 establishes that one tails is tossed.
 will be for the number of heads, where n is the number of times the coin is flipped.
Finally,  will ensure all possibilities, without which one will find the probability of getting a tails first and then only heads.
Simplifying  

We are told that the chances are between 0.1 and 0.2: 

Plugging in values for n: 
1: 1/2 which is the same as 5/10 out of range
2: 2/4 which is the same as 5/10 out of range
3: 3/8 which is closer to 1/2 than to 2/10 out of range
4: 4/16 which is the same as 2.5/10 out of range
5: 5/32 when one changes in the inequality to be  one sees that it is in range
6: 6/64 which is going to be smaller than 1/10 out of range
The coin has to have been flipped 5 times.

SUFFICIENT
(2) The chance that the coin lands head side up exactly once is the same as the chance that the coin lands tail-side up exactly once.
As the chances are the same, it is impossible that one make two equations equal to one another when they will cancel out.
INSUFFICIENT 

ANSWER : A

Test: Data Insights - 8 - Question 11

Mrs. Claus is selecting three reindeer from the herd for a special sleigh ride. Among the herd are Rudolph, Blitzen, and Comet. What is the probability that she chooses Rudolph, but not Blitzen and not Comet?
(1) The probability that she chooses Rudolph and Blitzen, but not Comet, is 1/14.
(2) The probability that she chooses none of Rudolph, Blitzen, and Comet is 5/21.

Detailed Solution for Test: Data Insights - 8 - Question 11

Assuming there are a total of n reindeer, the probability that Mrs. Claus chooses Rudolph but not Blitzen or Comet, that is, P(Rudolph, X, X) where X stands for any reindeer other than Blitzen and Comet, is:

We multiply by 3 because Rudolph, X, X can be chosen in three different ways: {Rudolph, X, X}; {X, Rudolph, X}; and {X, X, Rudolph}.
(1) The probability that she chooses Rudolph and Blitzen, but not Comet, is 1/14.

No need to solve this equation. Start substituting values of n greater than 3 and observe that as n increases, the value of the left-hand side decreases. Therefore, there is only one value of n greater than or equal to 4 for which the left-hand side is exactly 1/14 (this happens when n = 9). Knowing n allows us to compute the required probability. Sufficient.

(2) The probability that she chooses none of Rudolph, Blitzen, and Comet is 5/21.
This implies:

Similarly, there is no need to solve this equation. n must be at least 6, and as n increases, the left-hand side increases toward 1. Therefore, there is only one value of n greater than or equal to 6 for which the left-hand side is exactly 5/21 (this happens when n = 9). Knowing n allows us to compute the required probability. Sufficient.

Answer: D

Test: Data Insights - 8 - Question 12

­There are three different ways to score in basketball. A successful shot from beyond an arc drawn on the court is worth 3 points. Shots made from inside the arc are worth 2 points. If a player is fouled by another player, the fouled player may shoot "free throws," which are worth 1 point each. A certain team scored 45 points in a game. The team made twice as many 2-point shots as 3-point shots. How many free throws did the team make?
(1) The team attempted 12 free throws.
(2) Five-sixths of the team's free-throw attempts were successful.

Detailed Solution for Test: Data Insights - 8 - Question 12

Let the number of one-pointers = x, the number of two-pointers = y and the number of three-pointers = z
x + 2y + 3z = 45
We are told "The team made twice as many 2-point shots as 3-point shots". That means y = 2z.
Plugging that back in:
x + 2(2z) + 3z = 45
x + 7z = 45

­(1) The team attempted 12 free throws.
The team could have missed all of them, made all of them or made any number inbetween.
INSUFFICIENT

(2) Five-sixths of the team's free-throw attempts were successful.
This tells us that the number of freethrows that went in is a multiple of 5. This means that the value's unit digit will be either 0 or 5.
Looking at x + 7z = 45 , as x will end in either 0 or 5, 7z will have to end in the opposite value to ensure we have a units digit of 5.
The first number where 7z will end in 0, is when z is 10 (7(10) = 70. This obviously cannot hold as this is well above the 45 points scored, and the game does not have negative points. Therefore, 7z needs to end in 5. The first time that occurs is when z = 5 (7(5) = 35) and the next will be z = 15 (7(15) = 105), which once again exceeds 45. Therefore z = 5 x + 35 = 45
x = 10
SUFFICIENT
ANSWER : B

Test: Data Insights - 8 - Question 13

­When David drove from his home to his parents' home, was his average speed between 35 miles per hour and 50 miles per hour?
(1) To the nearest 100 miles, the distance that David drove from his home to his parents' home was 300 miles.
(2) To the nearest hour, it took David 8 hours to drive from his home to his parents' home.­­

Detailed Solution for Test: Data Insights - 8 - Question 13

(1) To the nearest 100 miles, the distance that David drove from his home to his parents' home was 300 miles.
The above implies that the distance is between 250 and 350 miles, which is not sufficient to get the speed.

(2) To the nearest hour, it took David 8 hours to drive from his home to his parents' home.­­
The above implies that the time is between 7.5 and 8.5 hours, which is also not sufficient to get the speed.
(1) + (2) The speed could be anywhere between 250/8.5 ≈ 30 to 350/7.5 ≈ 45 miles per hour. Therefore, the speed may or may not be between 35 miles per hour and 50 miles per hour. Not sufficient.
Answer: E.

Test: Data Insights - 8 - Question 14


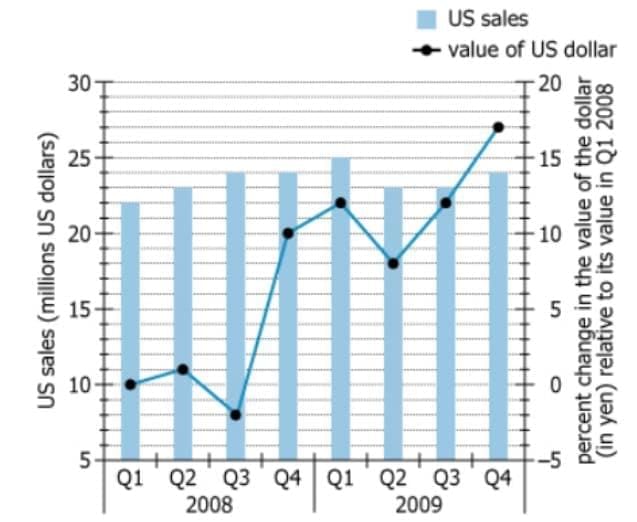
For each of the 8 quarters of 2008-2009, the graph shows a Japanese electronics firm ́s total US sales (rounded to the nearest 1 million US dollars), and the change in the average value of US dollar in Japanese yen, where the change is expressed as a percentage of the dollar ́s value in the first quarter of 2008 (Q1 2008), to the nearest 1 percent. For any given quarter, this data may be used to convert total US sales to their Q1 2008 yen equivalent: a value directly proportional to that quarter ́s total US sales in Q1 2008 yen.

On the basis of the information provided, choose the option that created the most accurate statement.

Q1 2008 yen-equivalent sales were highest in ___(A)___ of 2009.
Q1 2008 yen-equivalent sales for Q4 2009 were __(B)____ Q1 2008 yen-equivalent sales for Q4 2008. ­

Detailed Solution for Test: Data Insights - 8 - Question 14

We are given two components in the graph:-
a) Column gives the sales in US $ every quarter.
b) The line gives the % change in value of US$ against yen value in Q1 2008.
Therefore, if we have to find the actual sales relative to Q1 2008, we will have to multiply sales by the change in value of dollars. For example if sales have increased from 1 million $ to 2 million dollars but one dollar now is 2x, where one dollar was x number of yens in Q1 2008, then the actual sales as compared to teh value in Q 1 2008 will be 2 million *2x/x or 4 million dollars.
If one has understood the above, the question are very straightforward.
(A)
Highest sales in 2009 under given circumstances: Thr value of dollar in terms of yen is highest in Q4 2009 and the column in that quarter is second highest. Therefore, let us compare Thai with highest column, which is in Q2.
Q2 2009: 25million dollars * 1.12yen-equivalent = 28 million yen(Q1 yen-equivalent)
Q4 2009: 24million dollars * 1.17yen-equivalent = 28.08 million yen(Q1 yen-equivalent)
Answer: Q4 2009
(B)
Comparison: Q4 2009 vs Q4 2008
Q4 2009: 24million dollars * 1.17yen-equivalent
Q4 2008: 24million dollars * 1.10yen-equivalent
Height of sales is same as 24, but US dollar has a higher value, so Q 4 2009 will be higher.
Answer Q4 2009­ GREATER THAN Q4 2008­

Test: Data Insights - 8 - Question 15

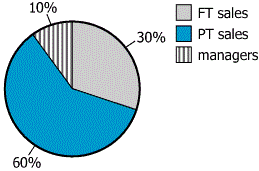
A retail store has 60 employees—full-time salespeople (FT sales), part-time salespeople (PT sales), and managers—in the proportions shown by the graph. Each full-time salesperson and each manager works the same number of hours per week; each part-time salesperson works exactly half that many hours per week.
The store wants the ratio of the total number of hours worked per week by full-time salespeople to the total number of hours worked by part-time salespeople to be 2:3 and wants to achieve this ratio without changing the number of managers or the number of hours each manager works per week.
Based on the information provided, choose creates the most accurate statement.
To achieve the desired ratio, the store could __(A)___ the number of full-time salespeople and ___(B)___ the number of part-time salespeople.­

Detailed Solution for Test: Data Insights - 8 - Question 15

Of the 60 employees, 30% are FT (= 18) and 60% are PT  (= 36)
FT are half in number but work twice the hours of PT so their ratio of total number of hours worked is 1:1.

We want to make it 2:3 by adding or reducing the number of FT and PT only. Since the ratio has to be reduced, we must need to decrease the number of FT and/or increase the number of PT. Keep an eye on the available options. 

Say each PT works x hrs and each FT works 2x hrs.

Ratio of total number of hours worked 
Denominator should be 3 times (18 - ?).
If we reduce 18 by 2, we get 16 but denominator cannot be made 48 (no option of adding 12 PTs)
If we reduce 18 by 4, we get 14 and denominator can be made 42 by adding 6 PTs. This works.

Decrease FTs by 4 and increase PTs by 6. ANSWER

Test: Data Insights - 8 - Question 16

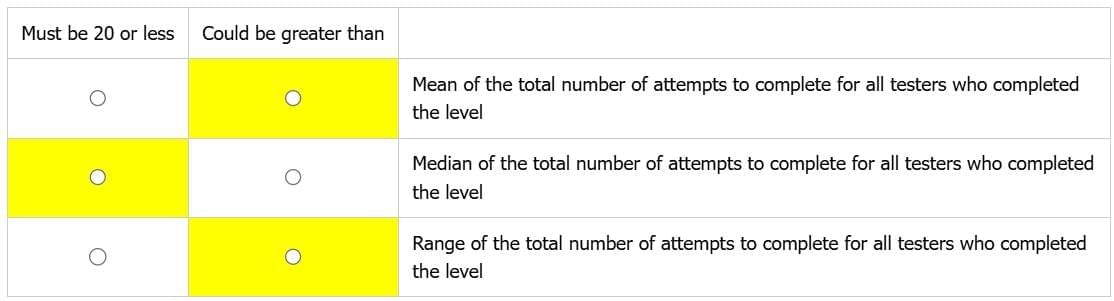
­The designers of a video game hired 100 game testers to play the game to determine whether the level of difficulty was appropriate. Each of the 100 testers made at most 25 attempts to complete each of the game's 15 levels (Levels 1–15). When a tester completed a level, he or she then made no further attempts at that level. For each of the levels, the table shows, among the testers who completed the level, the total number of testers whose number of attempts to complete that level fell in various ranges.

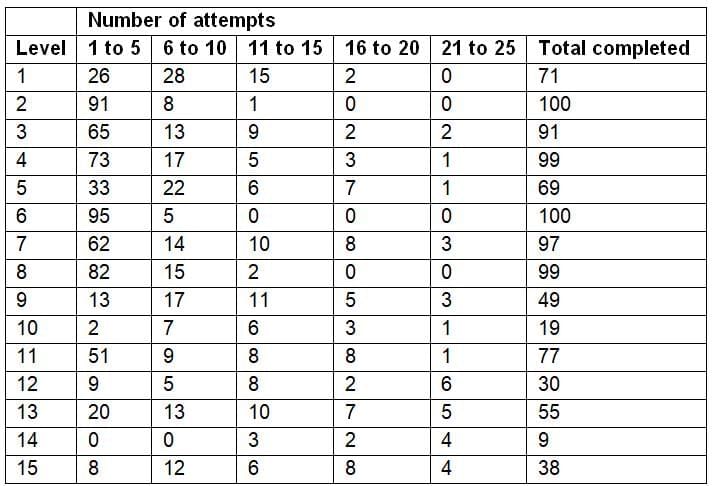
For each of the following statistical measures, select Must be 20 or less for every level if, based on the information provided, the measure must be at most 20 for each of the 15 levels. Otherwise, select Could be greater than 20 for one or more.

Detailed Solution for Test: Data Insights - 8 - Question 16

1. Mean of the total number of attempts to complete for all testers who completed the level.
Check if any of the levels has more number of attempts in 15-20 and 20-25 attempts than the sum of all other columns.
When you scan the table, the level 14 stands out as there are 3 in 11-15 attempts , 2 in 16-20 attempts and 4 in 21-25 attempts.
So, the max mean would be when all the testers took the maximum attempt in each case, so 3 took 15 attempts, 2 took 20 attempts and 4 took 25 attempts.
 Could be greater than 20.

2. Median of the total number of attempts to complete for all testers who completed the level
Check if any of the levels has more number of attempts in 20-25 attempts than the sum of all other columns.
When you scan the table, no level has sum of numbers under 1 - 5, 6 - 10, 11 - 15 and 16 - 20 attempts less than that under 21 - 25.
Thus median will always be 20 or less......Equal to or less than 20

3. Range of the total number of attempts to complete for all testers who completed the level
If any level has been finished be some tester in 1 - 5 attempts while there are some more who have finished it in 20 - 25 attempts, the maximum range could be 25 - 1 = 24.
There are many under this case: Level 3, 4, 5, 7, 9 - 15
Could be greater than 20­

Test: Data Insights - 8 - Question 17

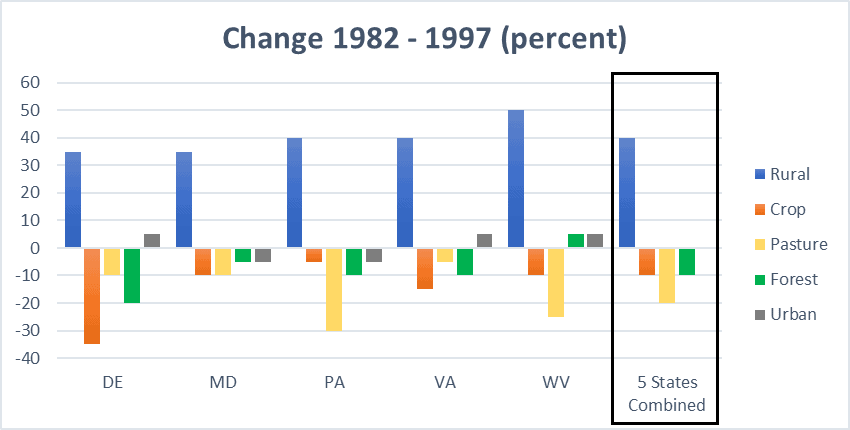
The graph above shows the changes in major land cover types in the given five-state region from 1982 to 1997.

The graph shows the percent change in the area of different land cover types across five states (DE, MD, PA, VA, and WV) as well as for these five states combined, from 1982 to 1997.

Choose the option that creates the most accurate statement based on the information provided.
If in 1997 Pennsylvania's (PA) rural land coverage equaled the average rural land coverage of the five states combined, then in 1982 Pennsylvania's rural land coverage was __(A)__ of the combined rural land coverage for all five states.

If Delaware (DE) and Maryland (MD) had similar acreage of land under crop in 1997, Delaware would have had approximately __(B)___ more acreage of cropland as compared to that in Maryland in 1982.­

Detailed Solution for Test: Data Insights - 8 - Question 17

(A)
Both Pennsylvania and the five states combined experienced a 40% increase in rural land coverage from 1982 to 1997. Thus, if in 1997 Pennsylvania's rural land coverage equaled the average for the five states combined, then in 1982 it also equaled the average, making Pennsylvania's rural land coverage 1/5, or 20%, of the total for the five states.

(B)
Assuming Maryland's cropland acreage in 1982 was 100 acres, then after a 10% drop by 1997, it would have 90 acres. Since Delaware and Maryland had the same cropland acreage in 1997, Delaware also had 90 acres. Given that Delaware experienced a 35% drop from 1982 to 1997, its 1982 cropland acreage would be acres. Therefore, in 1982, Delaware (140 acres) had 40% more cropland acreage than Maryland (100 acres).
Correct answer:
(A) : "20%"
(B): "40%"

Test: Data Insights - 8 - Question 18

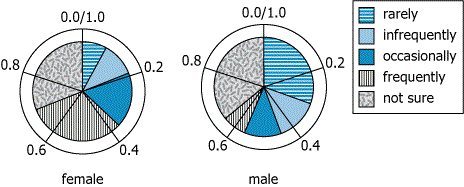
The two charts show how female and male survey respondents answered a question about how often they ate a certain type of food. The survey specified that "infrequently" meant more often than "rarely" but less often than "occasionally."

Choose the options that create the statement that most accurately reflects the information provided.

Slightly less than __(A)__ respondents indicated that they ate the food at most ___(B)___.­

Test: Data Insights - 8 - Question 19

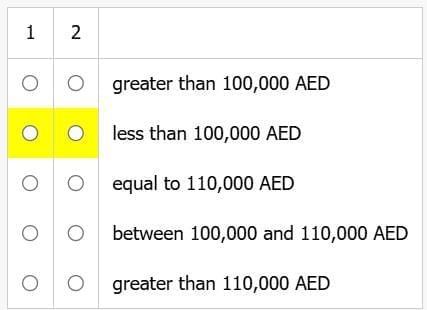
Companies A and B are part of the same industry and are located in the same city. For Company A, the average (arithmetic mean) salary of its employees, in United Arab Emirates dirhams (AED), is 10,000 AED higher than that for Company B. However, more than half of the employees at Company A have salaries below the average for Company B.

Statement: If the average salary at Company B is ___1___, then the median salary at Company A is ___2___.
Select for 1 and for 2 the options that complete the statement so that it most accurately reflects the information provided. Make only two selections, one in each column.­

Detailed Solution for Test: Data Insights - 8 - Question 19

Given,
More than half of the employees at Company A have salaries below the average for Company B.
Hence, the median salary would also be less than the average for company B.
Now, looking through options
If the average salary at Company B is greater than 100,000 AED
Then, median can be anything either greater or less than or equals 100,000 AED.
Hence no option satisfying it. In a similar way if we check logically through all options
Only less than 100,000 AED satisfies.
If the average salary at Company B is less than 100,000 AED than median will also be less that 100,000AED

Test: Data Insights - 8 - Question 20

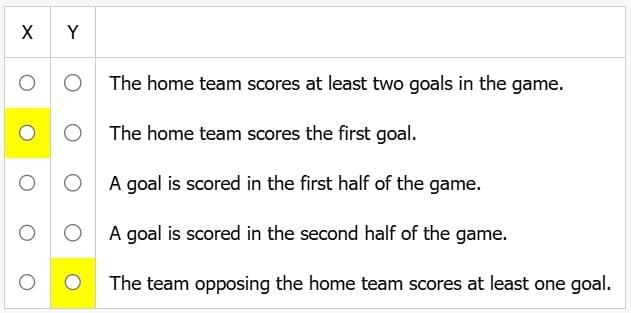
A statistician reached the following conclusions about games between university soccer teams: Overall, a team playing on its home field has a 45% chance of a win, a 25% chance of a loss, and a 30% chance of a draw (a tied outcome). In the games where one or more goals are scored, the team that scores the first goal has a 55% chance of scoring it in the game's first half and a 45% chance of scoring it later in the game. When that team is the home team (i.e., a team playing on its home field), there is a 40% chance that the other team will score no goals at all, and therefore a 60% chance that it will score one or more goals.

Select for X and for Y two different outcomes such that the information provided explicitly includes the statistician's estimates of the probability that if X occurs, so will Y. Make only two selections, one in each column.­

Detailed Solution for Test: Data Insights - 8 - Question 20

The probability scenarios are

  1.  Team playing on Home ground: W-45%, L-25% and D-30%
  2.  Games where at least one goal scored: First goal in first half - 55%; If home team scores first goal, 60% chances the other team will score at least one goal

Let us look at the question and the options:
So, we are looking at X happening translating in more than 50% chances of Y happening. 
If X, then more than 50% chances of Y happening.

Options: Let us take each as X, and see if some other option fits in as Y.

A. The home team scores at least two goals in the game.
We do not have a scenario where home team scores at least two goals resulting in some other option.

B. The home team scores the first goal.
Look at the point (2) in brown. If 'The home team scores the first goal.' is happening, then 60% probability that other team will score at least one goal. Option E gives us the exact words, so would fit in as Y.

C. A goal is scored in the first half of the game.
If ' A goal is scored in first half(55%), then Y can be 'the games where one or more goals are scored'. But that has to be true and we do not have any option fitting in as Y.

D. A goal is scored in the second half of the game.
Is it the first goal of the match or one of many scored? No situation in the para, so does not fit in as X.

E. The team opposing the home team scores at least one goal.
There is nothing connected to this option, so cannot fit in as X. However it is connected and dependent on another situation given in option B, and can fit in as Y.

X: The home team scores the first goal.
Y: The team opposing the home team scores at least one goal.

18 docs|33 tests
Information about Test: Data Insights - 8 Page
In this test you can find the Exam questions for Test: Data Insights - 8 solved & explained in the simplest way possible. Besides giving Questions and answers for Test: Data Insights - 8, EduRev gives you an ample number of Online tests for practice
Download as PDF