Test: Data Interpretation- 1 - SSC CGL MCQ
30 Questions MCQ Test SSC CGL Tier 2 - Study Material, Online Tests, Previous Year - Test: Data Interpretation- 1

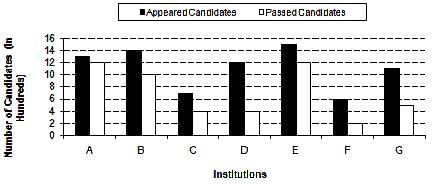
Study the following graph and answer the questions that follow.
Number of Appeared Candidates and Passed Candidates (in hundreds) in a test from seven different Institutions

Q. What is the difference between the number of candidates appeared from institutions B, C, D and F together and candidates passed from institutions A, E and G together?
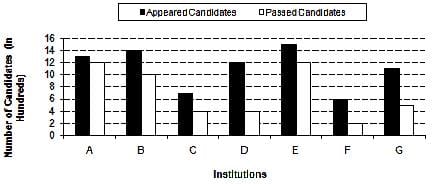
Number of Appeared Candidates and Passed Candidates (in hundreds) in a test from seven different Institutions
Q. What is the difference between the number of candidates appeared from institutions B, C, D and F together and candidates passed from institutions A, E and G together?
Study the following graph and answer the questions that follow.
Number of Appeared Candidates and Passed Candidates (in hundreds) in a test from seven different Institutions

Q. What is the average number of candidates passed from all the institutions together?
Number of Appeared Candidates and Passed Candidates (in hundreds) in a test from seven different Institutions

Study the following graph and answer the questions that follow.
Number of Appeared Candidates and Passed Candidates (in hundreds) in a test from seven different Institutions
Q. The number of candidates passed from institutions C and E together is approximately what percentage of the total number of candidates appeared from institutions A and G together?
Number of Appeared Candidates and Passed Candidates (in hundreds) in a test from seven different Institutions
Study the following graph and answer the questions that follow.
Number of Appeared Candidates and Passed Candidates (in hundreds) in a test from seven different Institutions

Q. From which institution is the difference between the appeared candidates and passed candidates the maximum?
Study the following graph and answer the questions that follow.
Number of Appeared Candidates and Passed Candidates (in hundreds) in a test from seven different Institutions
Q. What is the ratio of the number of candidates who have failed Institution B to the number of candidates who have appeared from institution F?
Study the following table carefully to answer the questions that follow.
Number of flights (in hundreds) cancelled in five different sates during six different years
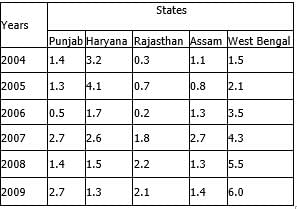
Q. What was the respective ratio between the number of flights cancelled in Rajasthan in the year 2006 and number of flights cancelled in West Bengal in the year 2009?
Study the following table carefully to answer the questions that follow.
Number of flights (in hundreds) cancelled in five different sates during six different years

Q. What was the average number of flights cancelled in all the state together in the year 2008?
Study the following table carefully to answer the questions that follow.
Number of flights (in hundreds) cancelled in five different sates during six different years
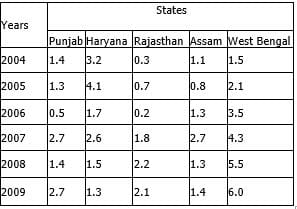
Q. What is the difference between the number of flights cancelled in Assam in the year 2007 and the total number of flights cancelled in Rajasthan in the year 2005, 2007 and 2008 together?
Study the following table carefully to answer the questions that follow.
Number of flights (in hundreds) cancelled in five different sates during six different years

Q. In which state the number of flights cancelled continuously increased during the years 2004 to 2009?
Study the following table carefully to answer the questions that follow.
Number of flights (in hundreds) cancelled in five different sates during six different years

Q. Number of flights cancelled in Haryana in the year 2004 was what percent of the total number of flights cancelled in Punjab over all the years together?
Study the following graph carefully and answer the question.
Water level of four major Rivers (in metres) in four different Months
Water level of four Rivers

Q. What was the respective ratio between the water level of River – C in September and the water level of River – B in June?
Study the following graph carefully and answer the question.
Water level of four major Rivers (in metres) in four different Months
Water level of four Rivers

Q. If the danger level of all the four rivers is above 215 m, which river has not crossed the danger level in August but has crossed the danger level in July?
Study the following graph carefully and answer the question.
Water level of four major Rivers (in metres) in four different Months
Water level of four Rivers

Q. What is the average water level of River –A in all the four months together?
Study the following graph carefully and answer the question.
Water level of four major Rivers (in metres) in four different Months
Water level of four Rivers

Q. In which river and in which month respectively the water level is highest?
Study the following graph carefully and answer the question.
Water level of four major Rivers (in metres) in four different Months
Water level of four Rivers
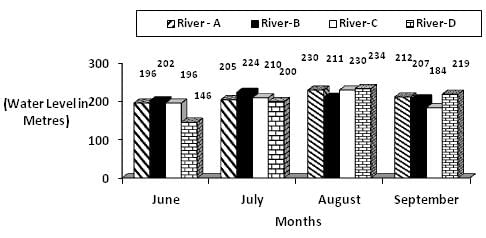
Q. If the water level of River-A in July is decreased by 20%, then what will be the water level of River-A in July
Study the following table carefully to answer the questions that follow:
Number of Students Appeared (A) and Failed (F) in Five
Classes of a school over the years
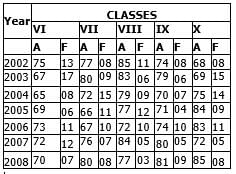
Q. What is the number of passed students for all the classes together in the year 2007?
Study the following table carefully to answer the questions that follow:
Number of Students Appeared (A) and Failed (F) in Five
Classes of a school over the years
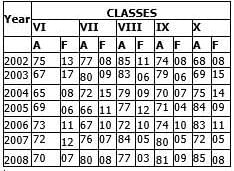
Q. What is the average number of failed students from Class VIII for the given years?
Study the following table carefully to answer the questions that follow:
Number of Students Appeared (A) and Failed (F) in Five
Classes of a school over the years

Q. What is the ratio of the total number of passed students to total number of failed students for the year 2005?
Study the following table carefully to answer the questions that follow:
Number of Students Appeared (A) and Failed (F) in Five
Classes of a school over the years

Q. What is the total percentage of passed students of Class IX from all the years together? (rounded off to two digits after decimal)
Study the following table carefully to answer the questions that follow:
Number of Students Appeared (A) and Failed (F) in Five
Classes of a school over the years

Q. Which of the following classes has the minimum number of passed students over the years?
Study the following table carefully and answer the questions given follow:
Monthly expenditure (in thousands) by five people on Rent, Food, Children’s education, Clothes and Traveling

Q. What is the total monthly expenditure made by D on rent, B on clothes and E on traveling together?
Study the following table carefully and answer the questions given follow:
Monthly expenditure (in thousands) by five people on Rent, Food, Children’s education, Clothes and Traveling

Q. What is the average monthly expenditure on food by all the people together?
Study the following table carefully and answer the questions given follow:
Monthly expenditure (in thousands) by five people on Rent, Food, Children’s education, Clothes and Traveling

Q. Whose monthly expenditure on all the heads together is the lowest among them?
Study the following table carefully and answer the questions given follow:
Monthly expenditure (in thousands) by five people on Rent, Food, Children’s education, Clothes and Traveling

Q. If the monthly expenditure of C on Children’s education is increased by 5%, then what will be his yearly expenditure on Children’s education?
Study the following table carefully and answer the questions given follow:
Monthly expenditure (in thousands) by five people on Rent, Food, Children’s education, Clothes and Traveling
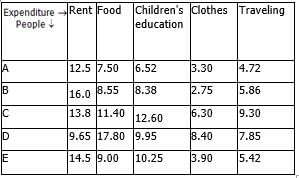
Q. What is the ratio of the monthly expenditure made by A on traveling to the monthly expenditure made by D on clothes?
Study the graph and answer the questions that follow:
No. of candidates (in thousands) different Qualified in the written test for admission to two different institutions
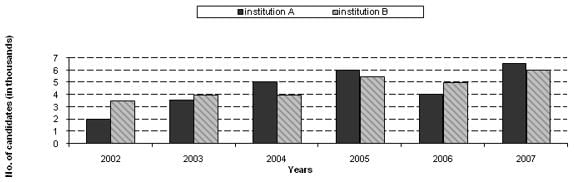
Q. What was the ratio of the number of candidates qualified in the written test in the year 2002 for admission to institution B to the number of candidates qualified in the written test in the year 2006 for admission to institution A?
Study the graph and answer the questions that follow:
No. of candidates (in thousands) different Qualified in the written test for admission to two different institutions
Q. What was the approximate average number of candidates qualified in the written test for admission to institution B over all the years?
Study the graph and answer the questions that follow:
No. of candidates (in thousands) different Qualified in the written test for admission to two different institutions
Q. In which year was the total number of candidates qualified in the written test for admission to both the institutions together the second highest?
Study the graph and answer the questions that follow:
No. of candidates (in thousands) different Qualified in the written test for admission to two different institutions
What is the difference between the total number of candidates qualified in written test in year 2006 for admission to institution A and B together and the number of candidates qualified in written test in year 2003 for admission to institution A ?
Study the graph and answer the questions that follow:
No. of candidates (in thousands) different Qualified in the written test for admission to two different institutions
Q. What was the total number of candidates qualified in the written test for admission to institution A over all the years together?
|
1366 videos|1313 docs|1016 tests
|
|
1366 videos|1313 docs|1016 tests
|


Important Questions for Data Interpretation- 1
Data Interpretation- 1 MCQs with Answers
Online Tests for Data Interpretation- 1 SSC CGL Tier 2 - Study Material, Online Tests, Previous Year
|
© EduRev
|
Education Revolution
|


|


