|
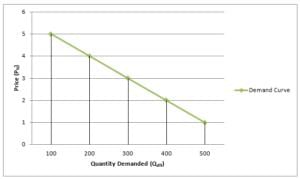
The demand function is a mathematical representation of the relationship between the quantity demanded (X) of a good and its price (P), assuming other factors remain constant. 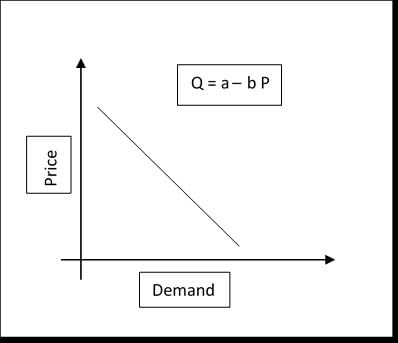 |
Card: 2 / 45 |
|
True or False: An increase in the price of a commodity will typically lead to an increase in the quantity demanded. |
Card: 5 / 45 |
|
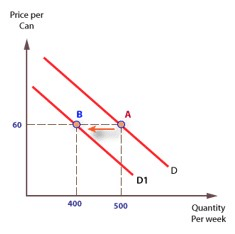
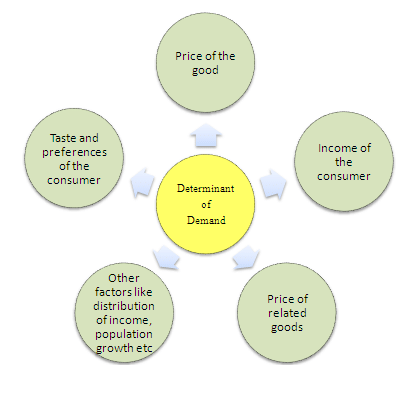
The factors include prices of other goods (substitutes and complements), consumer income, and consumer's tastes and preferences.
|
Card: 8 / 45 |
|
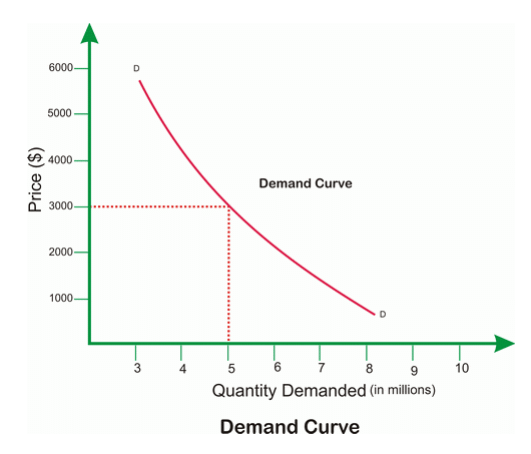
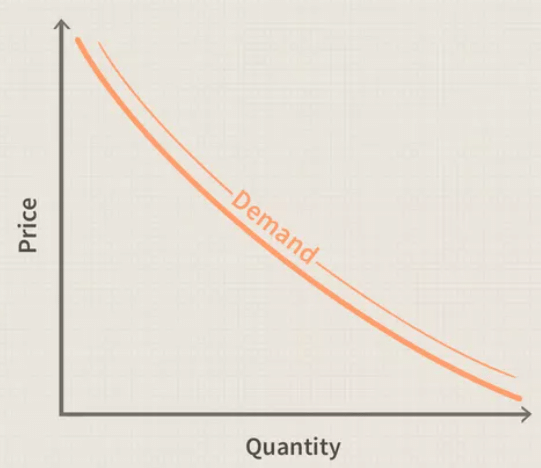
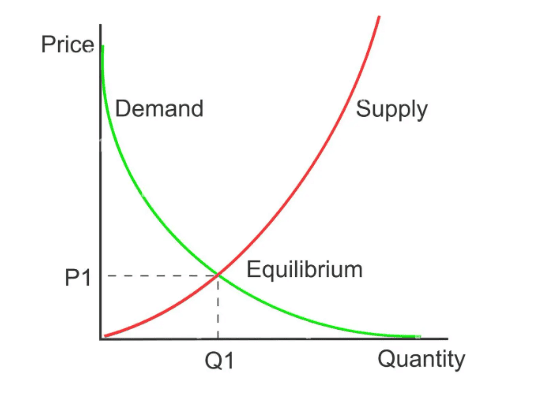
Riddle: I am a curve that shows how price affects quantity, sloping downwards, I help understand demand. What am I? |
Card: 9 / 45 |
|
Fill in the blank: Demand refers to the quantity that a consumer is both ___ and ___ to buy. |
Card: 13 / 45 |
|
What is the graphical representation of the relationship between price and quantity demanded called? |
Card: 15 / 45 |
|
MCQ: Which of the following factors does NOT directly affect the demand for a good? A) Consumer income B) Price of substitutes C) The weather D) Consumer preferences |
Card: 17 / 45 |
|
A function is a relationship between two variables, x and y, denoted as y=f(x), where each value of x corresponds to a unique value of y. |
Card: 20 / 45 |
|
The demand function is represented as ___ and indicates the relationship between ___ and ___? |
Card: 21 / 45 |
|
X = f(P); it indicates the relationship between quantity demanded X and price P. 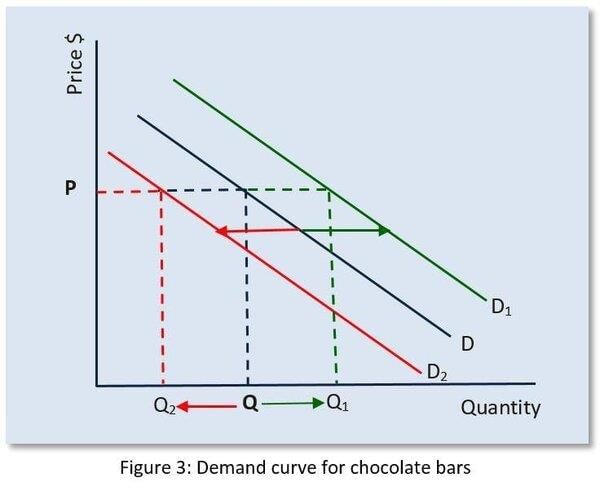 |
Card: 22 / 45 |
 Unlock all Flashcards with EduRev Infinity Plan Starting from @ ₹99 only
|
|
True or False: An increasing function is characterized by the value of y decreasing as x increases. |
Card: 23 / 45 |
|
False. An increasing function is characterized by the value of y not decreasing as x increases. 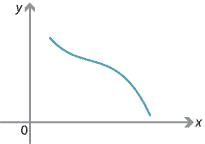 |
Card: 24 / 45 |
|
Fill in the blank: A function is decreasing if the value of y does not ___ with an increase in x. |
Card: 25 / 45 |
|
It visually represents the relationship between the independent variable x and the dependent variable y. |
Card: 28 / 45 |
|
Riddle: I can be increasing or decreasing, my values depend on your choice. What am I? |
Card: 29 / 45 |
|
In economics, the independent variable is often plotted on the ___ axis and the dependent variable on the ___ axis. |
Card: 31 / 45 |
|
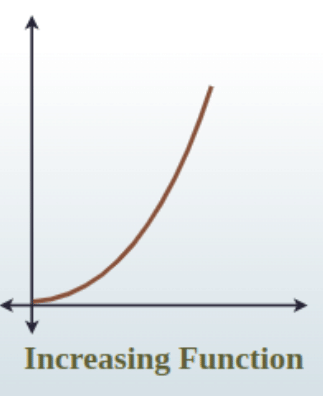
How would you describe the graphical representation of an increasing function? |
Card: 33 / 45 |
|
A function is increasing if the value of y does not decrease with an increase in x; it is decreasing if the value of y does not increase with an increase in x. |
Card: 37 / 45 |
|
The Law of Demand states that when the price of a commodity increases, the quantity demanded ___, assuming other factors remain constant. |
Card: 38 / 45 |
|
Fill in the blanks: A drop in the price of bananas results in an increase in the quantity demanded due to the ___ effect and the ___ effect. |
Card: 40 / 45 |
|
True or False: A linear demand curve can be represented by the formula Q = a - bP, where Q is quantity demanded, P is price, a is the intercept, and -b is the slope. |
Card: 42 / 45 |
|
If the price of bananas is reduced from P1 to P2, what happens to the consumer's budget set? |
Card: 44 / 45 |
|
The budget set expands, allowing the consumer to purchase more bananas and fewer mangoes. |
Card: 45 / 45 |


