|
Ensure data is presented correctly, including selecting the appropriate range of cells that contain the data and row headings for axis labels.  |
Card: 2 / 20 |
|
False. A bar chart presents data in horizontal bars, while a column chart presents data in vertical columns. 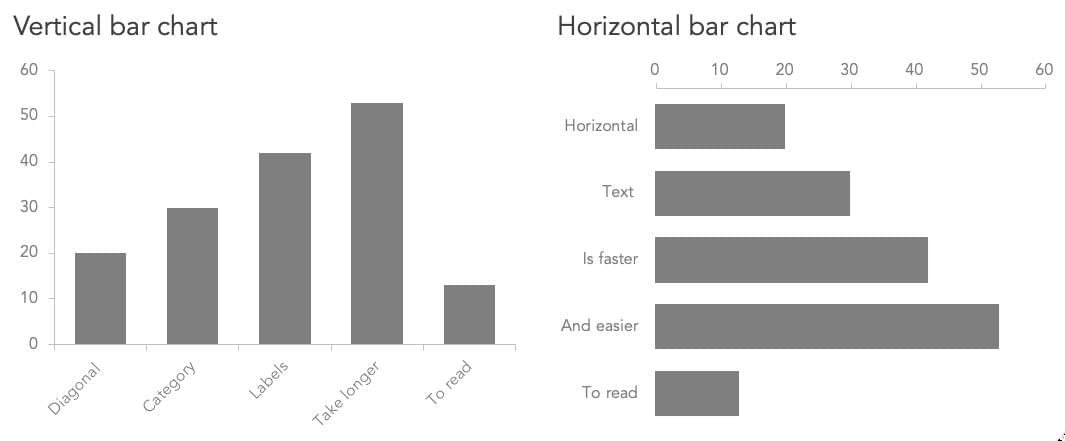 |
Card: 6 / 20 |
|
What type of chart gets created automatically after selecting a chart type in Excel? |
Card: 7 / 20 |
|
Excel automatically creates and inserts the selected chart type onto your worksheet. 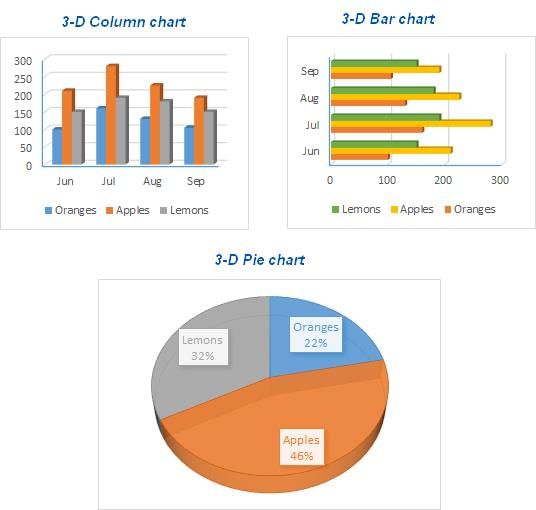 |
Card: 8 / 20 |
|
Fill in the blank: A column chart is a type of chart that presents data in ___ columns. |
Card: 9 / 20 |
|
Riddle: I can show changes over time, displayed in bars or columns. What am I? |
Card: 11 / 20 |
|
What should you do if you want to change the chart type after creating it in Excel? |
Card: 13 / 20 |
|
You can select a different chart type from the chart options available in the Insert menu. 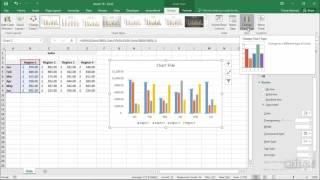 |
Card: 14 / 20 |
|
Including row headings is important because they serve as axis labels in the finished chart, helping to identify the data being represented. 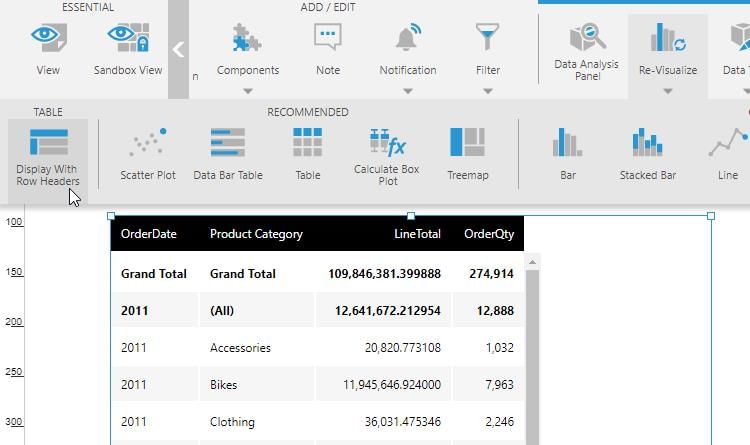 |
Card: 16 / 20 |
|
The three types of cell references used in Excel formulas are relative, absolute, and mixed.  |
Card: 18 / 20 |
|
In a relative reference, when a formula is copied to another location, what happens to the cell reference? |
Card: 19 / 20 |
|
Excel updates the cell reference inside the formula to reflect its new position.  |
Card: 20 / 20 |
 Completed! Keep practicing to master all of them. |


