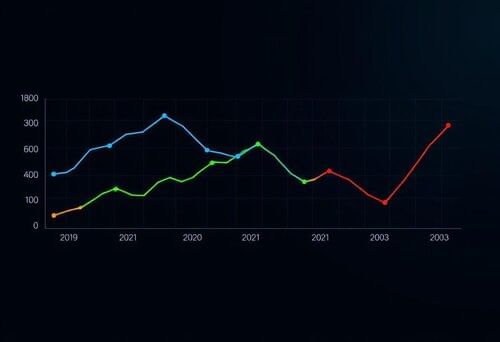
|
In a dot plot, if March has a dot at level 4 and April has a dot at level 9, this indicates that ___. |
Card: 5 / 40 |
|
Fill in the blank: Frequency charts display data collected in groups or ranges, showing how often values fall within each ___. |
Card: 9 / 40 |
|
Fill in the blank: A frequency chart of distances to school shows that the range of 0–1 km has a frequency of ___. |
Card: 11 / 40 |
|
True or False: Frequency charts can provide exact values for data points within a range. |
Card: 13 / 40 |
|
False. Frequency charts cannot specify exact values within a range, such as 0.5 km or 2.3 km. |
Card: 14 / 40 |
|
What is the primary purpose of grouping data into ranges in a frequency chart? |
Card: 17 / 40 |
Grouping DataThe Purpose of Data Grouping in Frequency Charts
|
Card: 18 / 40 |
 Unlock all Flashcards with EduRev Infinity Plan Starting from @ ₹99 only
|
|
Fill in the blank: Continuous data can take any value within a range, such as ___, volume, and temperature. |
Card: 21 / 40 |
|
Multiple Choice: Which of the following is a key feature of line graphs? A) Discrete data representation B) Points plotted and connected by lines C) Fixed categories D) No axes |
Card: 23 / 40 |
|
Fill in the blank: A line graph is unsuitable for discrete data, such as the number of visitors to a skate park, because it implies ___ between points. |
Card: 27 / 40 |
|
False. Line graphs are not suitable for discrete data as they imply continuity. 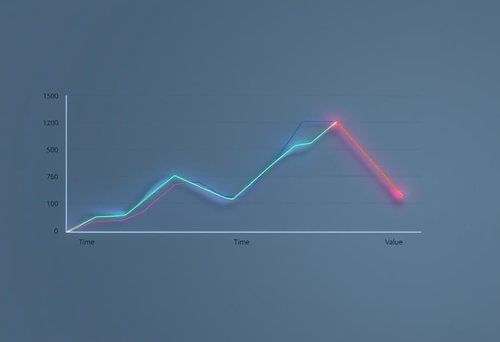 |
Card: 30 / 40 |
|
Riddle: I show changes over time with connected points, but I'm not for counting things. What am I? |
Card: 31 / 40 |
|
Fill in the blank: Points connected by lines in a line graph help illustrate ___ or changes in the measured quantity. |
Card: 35 / 40 |
|
During which day did Sanchia use the most water for handwashing according to the example? |
Card: 39 / 40 |


